Dashboard
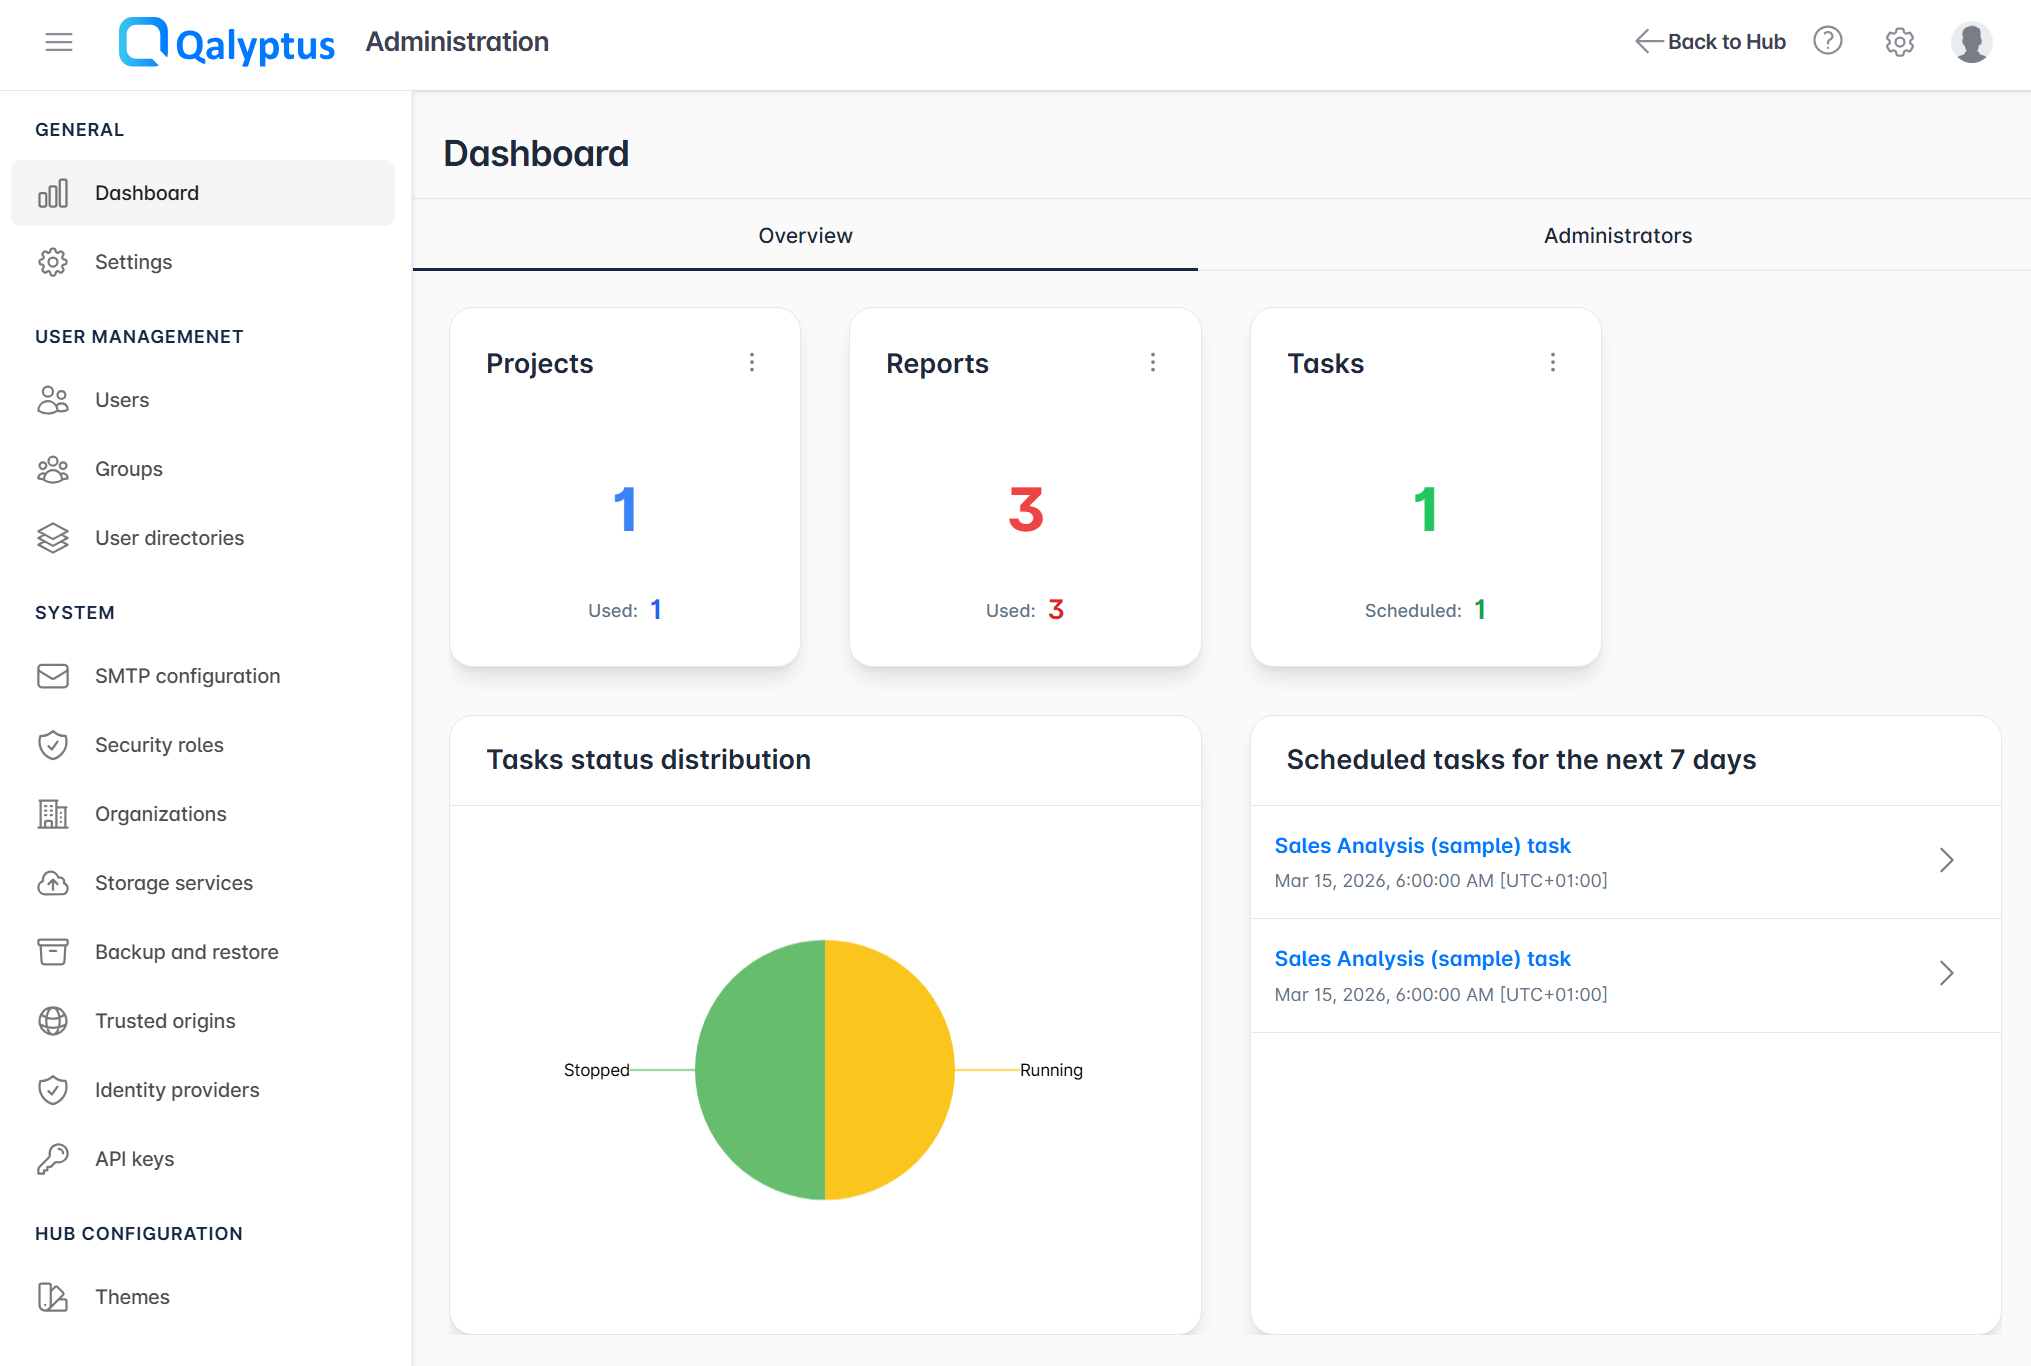
The Dashboard provides a centralized overview of your Qalyptus Server, giving administrators a quick snapshot of all key entities and their current state.
To access it, navigate to Administration > General > Dashboard.
Overview Metrics
The top section of the Dashboard displays counters for the main entities in Qalyptus Server:
| Metric | Description |
|---|---|
| Projects | Total number of projects, including how many are used in at least one scheduled task |
| Reports | Total number of reports, including how many are used in one or more tasks |
| Tasks | Total number of tasks, including how many have at least one schedule configured |
Task Status Distribution
The Task Status Distribution chart provides a visual breakdown of all scheduled tasks by their current status. This helps quickly identify tasks that may require attention, such as those in an error or stopped state.
Scheduled for the Next 7 Days
The Scheduled for the next 7 days section lists all tasks that are scheduled to run within the next 7 days, along with their planned execution date and time. Use this view to anticipate upcoming activity and verify that critical tasks are correctly scheduled.
Administrators
The Administrators tab on the Dashboard lists all users who have been granted the administrator role in Qalyptus Server.