Create HTML Report
This section will create an HTML report using Qlik Sense objects.
To create an HTML report, go to the Reports tab and click Create report button.
- Give a name to your report
- Add a description if you wish (optional)
- In the Type drop-down menu, select HTML
- Select a project
- Click Save
You will be redirected to the report Overview tab. In the Template field, click the Edit button. An HTML file will be opened.
-
The Qalyptus Cloud template is opened on the right
-
The Apps tab lists all your Qlik Sense apps. You can select one or more apps to use to create the report. After choosing an app, click on the three-point button to refresh its metadata (variables, objects, and fields)
-
The Variables tab lists the Qlik variables of the selected apps. Select the ones you want to use
-
The Objects tab lists the Tables, Charts, and Master Items of the selected apps. Select the ones you want to use
-
The Overview tab shows selected objects and variables to use in your template
-
The Save button allows you to save the template file
-
The Preview button allows you to have a preview of the report
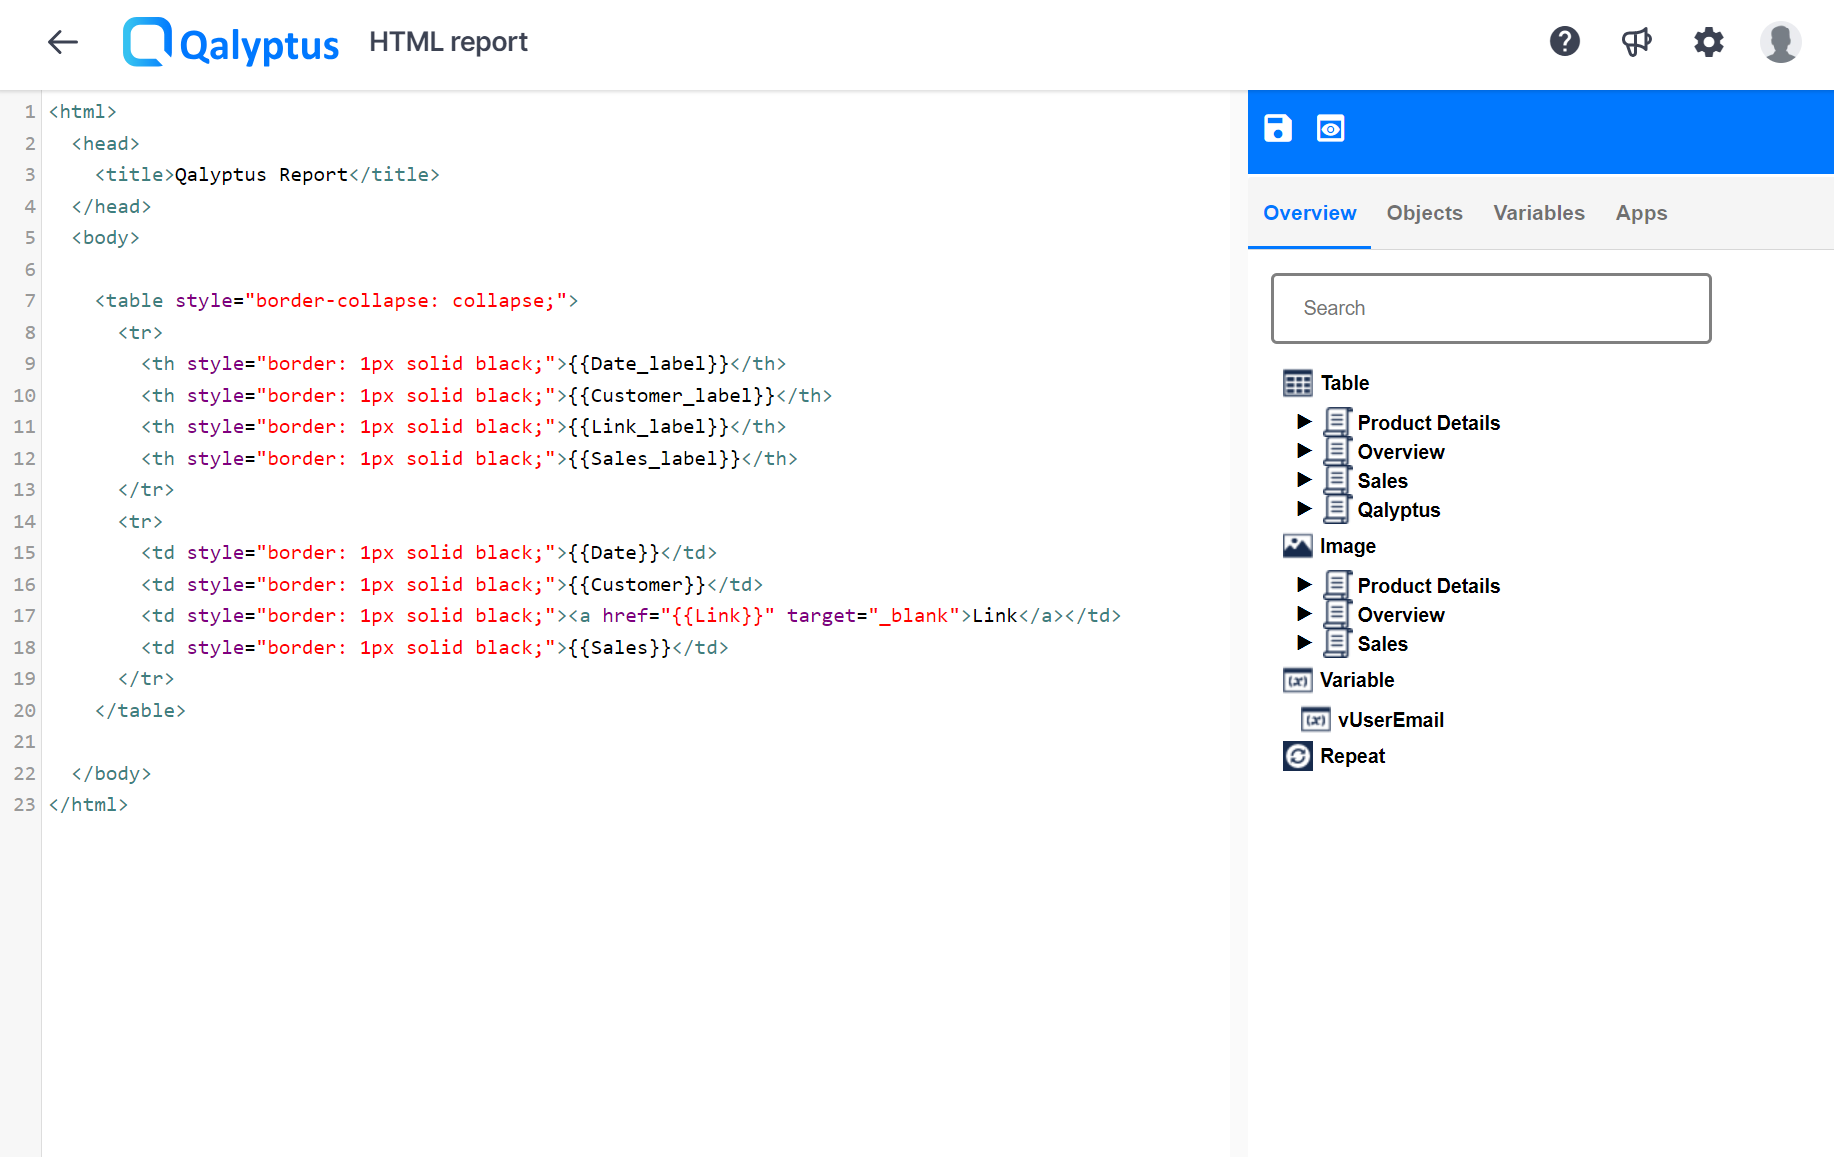
Add objects to create the template file
Let's create a simple template using a chart, a table, and a variable.
- Select the Apps tab and choose a Qlik Sense app
- In the Variables tab, right-click on a variable and select Add variable
- In the Objects tab, find the chart you want to use, right-click, and choose Use object as an image. Find the object table you wish to use, right-click, and select Use ** object as table**
- Select the Overview tab to insert the object into the file
- Before inserting an item, don't forget to position the cursor where you want to insert the element
- Under the Variables node, right-click on the variable previously added and choose Insert
- Under the Table node, right-click on the table object previously added, and select Insert or Insert columns. The first option will use the whole object, which will be exported as it is in Qlik Sense? The second one will allow you to format each column of the table using the Word features
- Under the Image node, right-click on the chart previously added and select Insert
- You can use all the HTML possibilities to format the file: resize the chart image, format the table columns, add additional text and images, etc.
- Click Preview to see the result
- Click Save to save the file. You can close the file and back to Qalyptus Cloud