Advanced features
Overview
This section explains the advanced features available when designing Excel templates in Qalyptus Cloud. You will learn how to apply object-level filters, prevent row insertion, control PivotTable presentation, customize exported object sizes, create native Excel PivotTables, export URLs and images, and use Excel formulas in reports.
Add a filter to an object
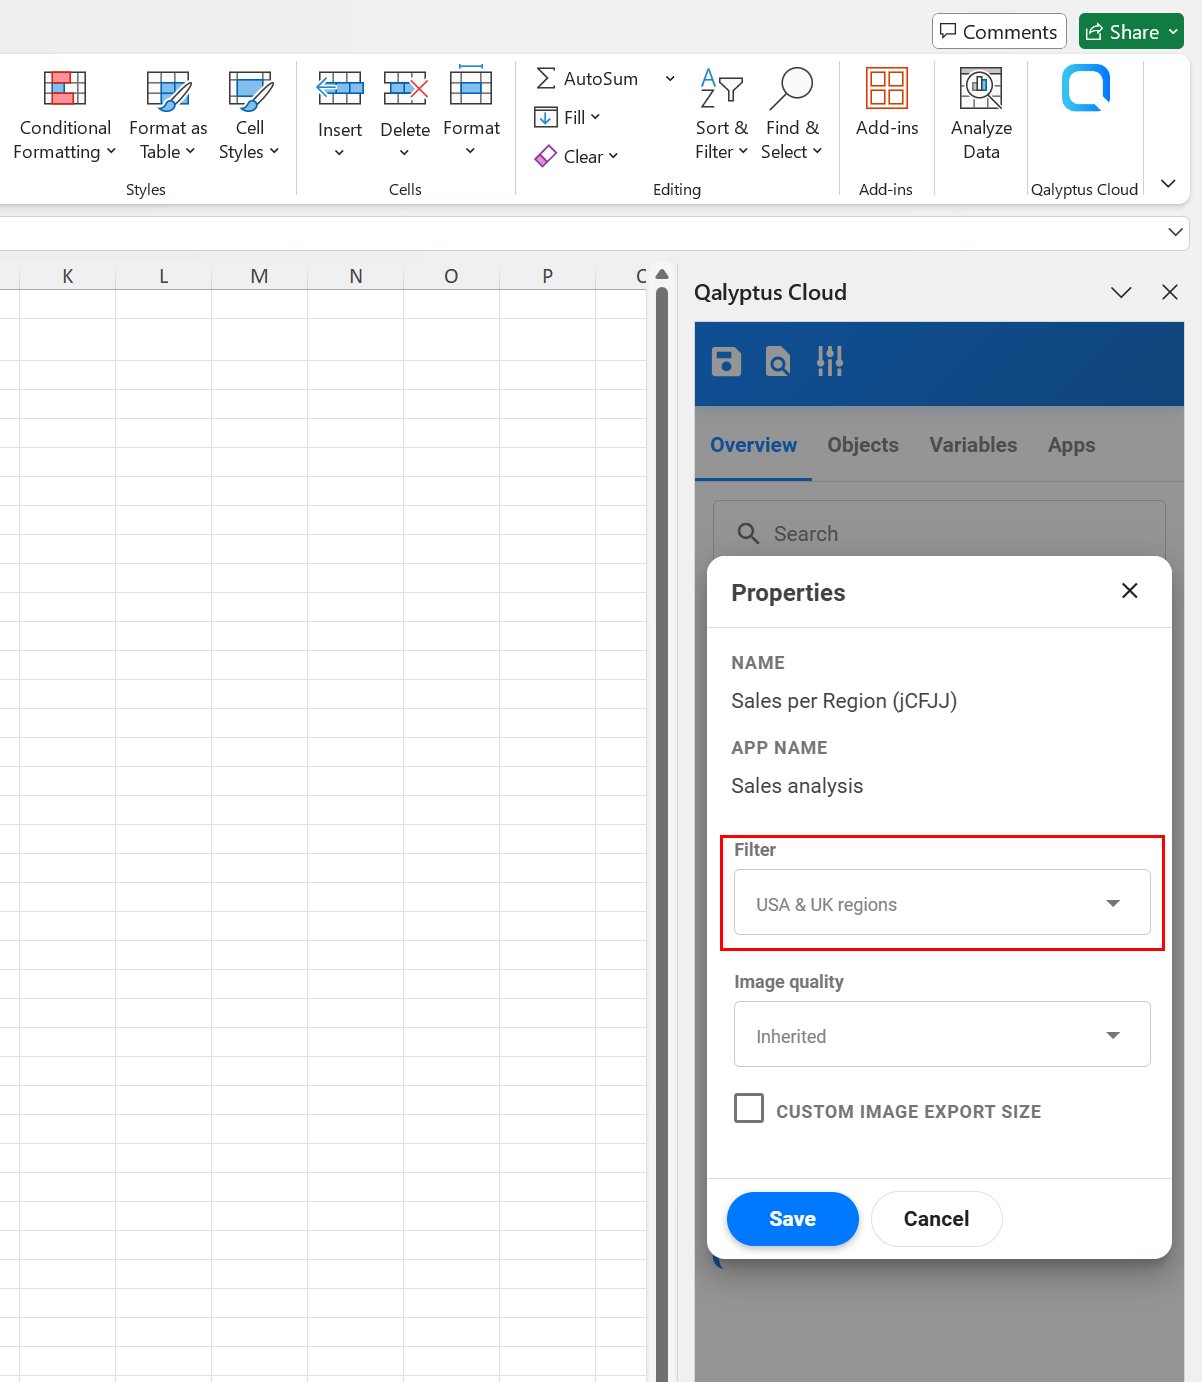
In addition to applying filters at the report level, you can apply a filter to each Qlik object in your template.
To filter an object in the report:
- Open the report template.
- Go to the Overview tab of the Qalyptus Office add-in.
- Click the three dots button next to the object.
- Click Properties.
- Select the filter to apply from the list.
- Click Save.
The object filter is applied after task-level filters or selections made in the Qalyptus Cloud extension.
If the report is an Iteration Report, the object filter is also applied after the iteration selection.
Be aware that Qlik Sense selections can override existing selections if they are outside the current selection scope.
Only one filter can be applied to an object. However, you can combine multiple selections inside the same filter.
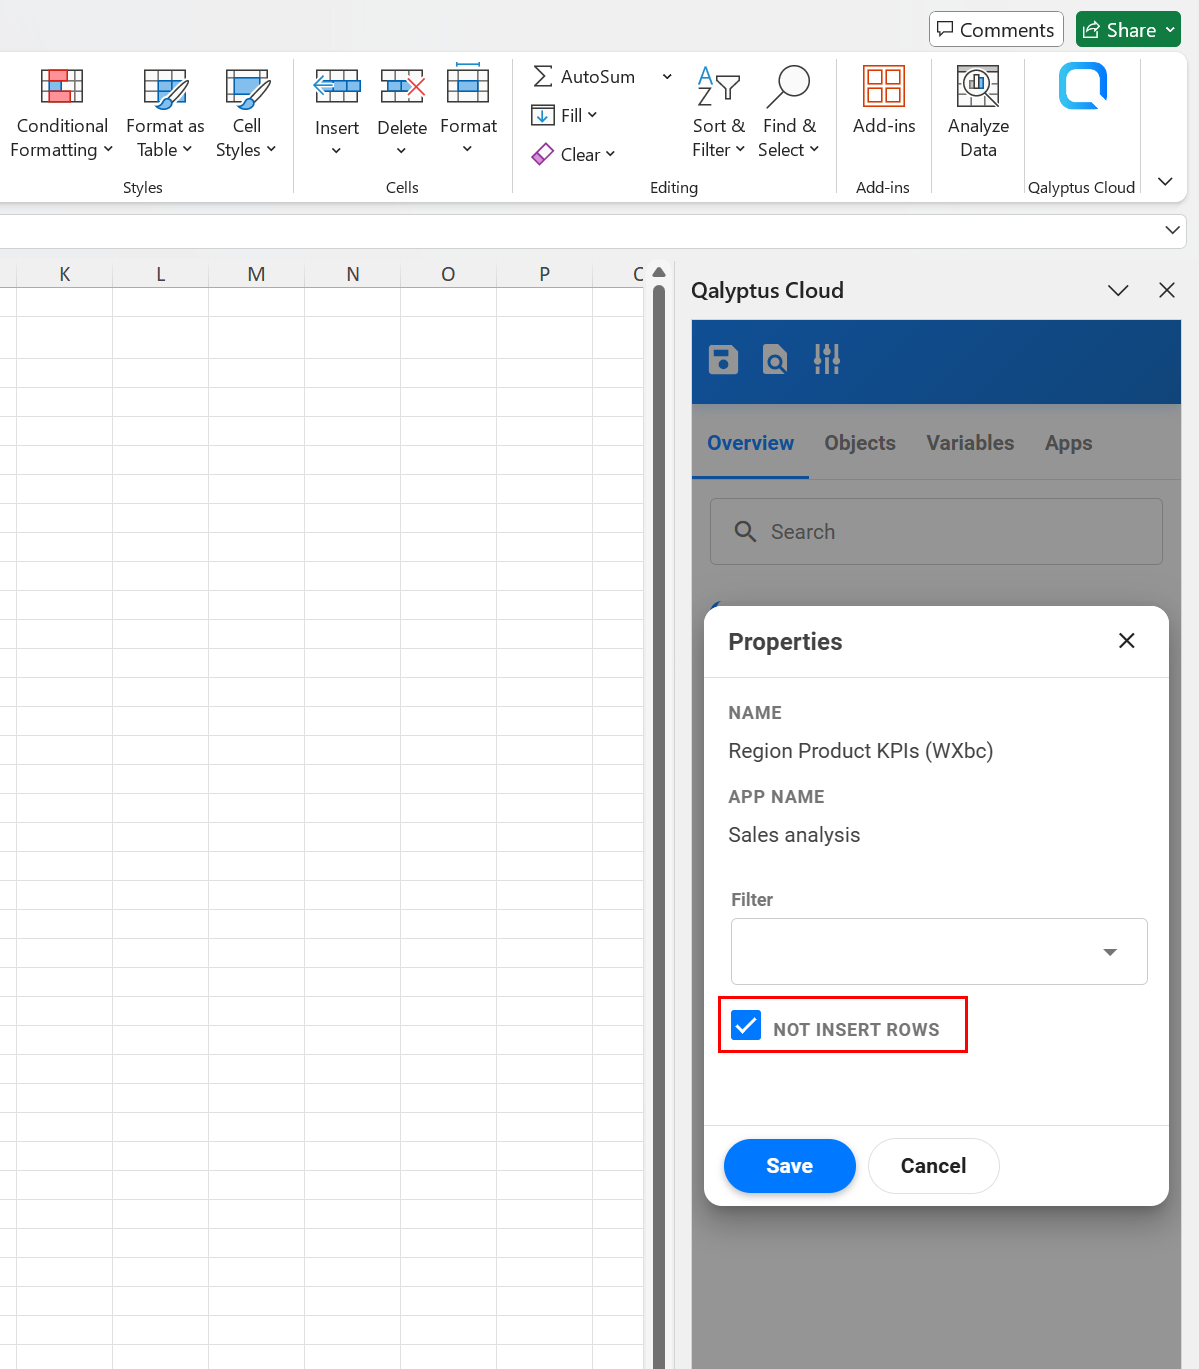
Not insert new rows option
By default, Qalyptus inserts new rows when exporting a table or PivotTable to maintain layout consistency.
In some cases, however, you may want Qalyptus to not insert rows, such as when you place multiple objects side by side.
The Not insert rows option is available only for objects used as tables or PivotTables.
To enable it:
- Open the report template.
- Go to the Overview tab of the Qalyptus Office add-in.
- Click the three dots button next to the object.
- Click Properties.
- Check Not insert rows.
- Click Save.
Choose Image Quality
By default, objects exported as images use the Normal quality level. The image quality for a report is defined in the report settings when you add it to a Task.
When you add an object to a report template, its image quality is set to Inherited by default, meaning it uses the quality level defined at the report level. However, you can override this setting for individual objects if needed.
How to Change Image Quality
- Open your report template**
- Navigate to the Overview tab in the Qalyptus Office add-in
- Access object properties:
- Click the three dots (⋮) button next to the object
- Select Properties
- Select your preferred Image quality option:
- Normal (92 DPI): Reduces file size while maintaining good visual clarity
- Medium (150 DPI): Balances resolution and performance
- High (300 DPI): Best for print-quality exports
- Optimized (144 DPI): A universal setting compatible with all object types
- Click Save
Quality Recommendations
We recommend using Optimized quality when:
- Your report contains multiple objects
- You're creating iteration reports that generate many files
- The report will run in parallel with other reports
The Optimized quality setting significantly reduces report generation time while maintaining good visual quality.
Tip: Always test your report with different quality settings to ensure the output meets your requirements before deploying to production.
Limitations
Note: Third-party objects (extensions) and sheet objects only support Normal image quality.
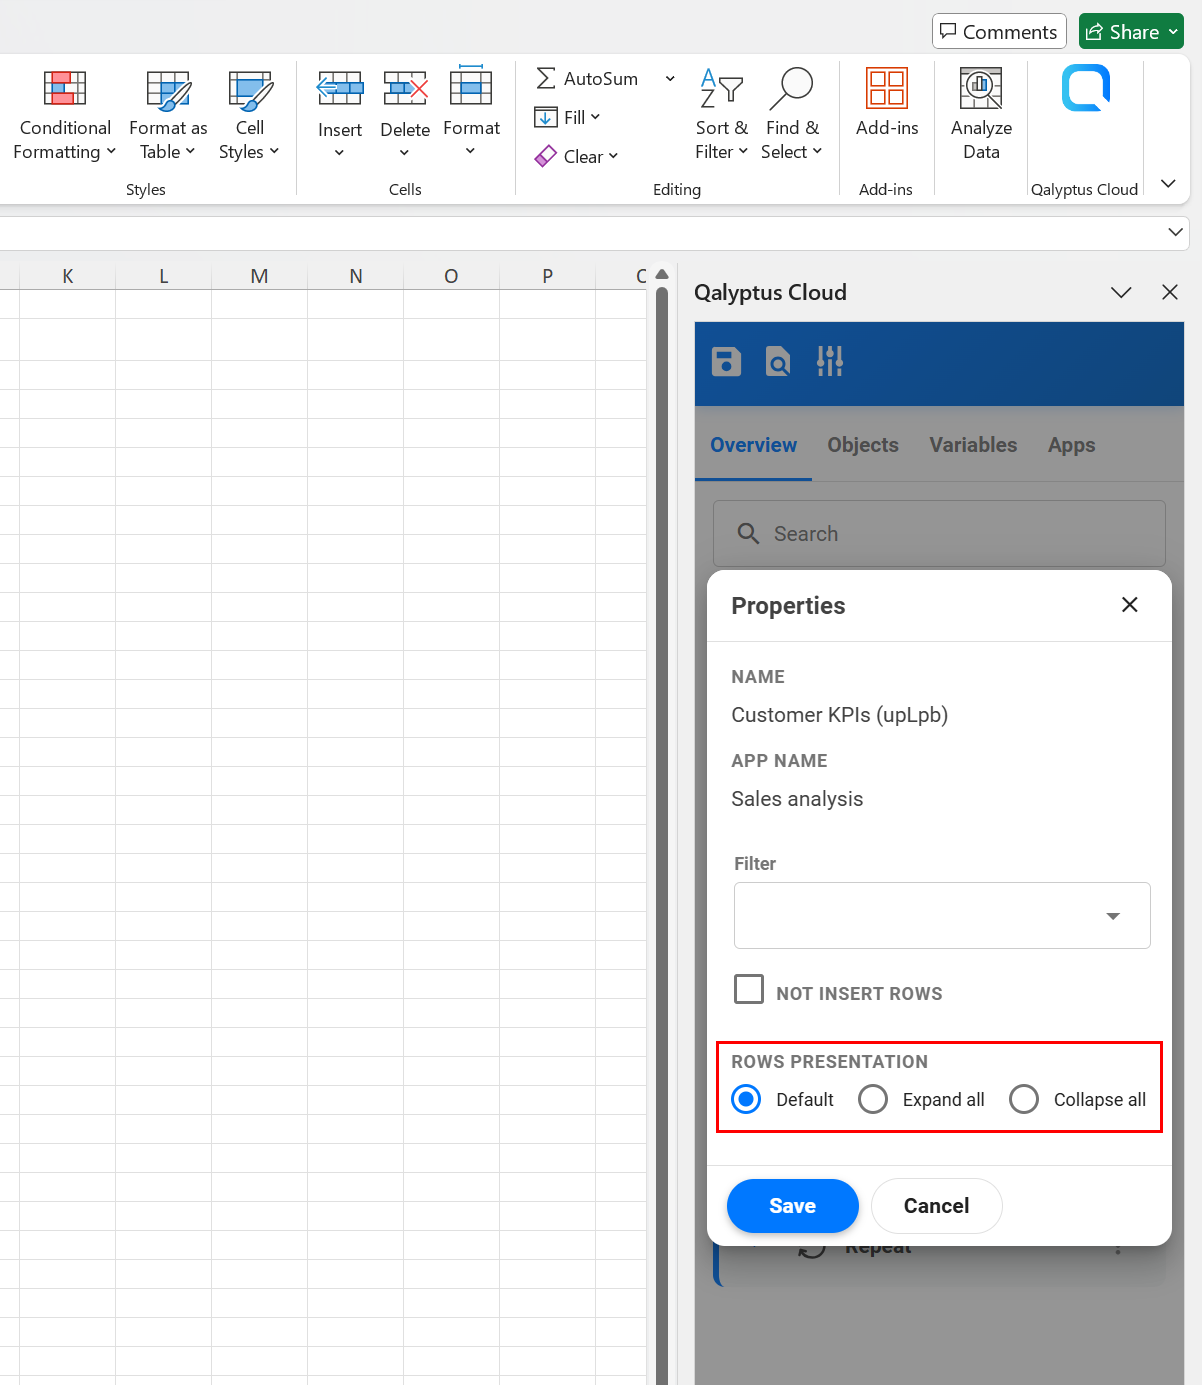
Choose PivotTable rows presentation
By default, PivotTables are exported with the same row presentation as in Qlik Sense.
With Qalyptus, you can override this behavior and choose how the PivotTable is displayed in the report.
Options include:
- Default – Use the same layout as in Qlik Sense.
- Extend all – Expand all levels.
- Collapse all – Collapse all levels.
To change the presentation:
- Open the report template.
- Go to the Overview tab of the Qalyptus Office add-in.
- Click the three dots button next to the PivotTable.
- Click Properties.
- Select the desired Rows presentation option.
- Click Save.
If your PivotTable in Qlik Sense is Fully expanded, Qalyptus cannot apply the Collapse all option.
Export an object with a different size
When you insert a Qlik Sense chart or table as an image, Qalyptus replaces the placeholder with the object image during report generation.
By default, the exported image matches the placeholder size, but you can specify a custom export size.
This is useful when you want to:
- Export larger images to display more details.
- Avoid scrollbars in exported tables.
To customize the size:
- Open the report template.
- Go to the Overview tab of the Qalyptus Office add-in.
- Click the three dots button next to the object.
- Click Properties.
- Check Custom export image size.
- Enter the Height and Width.
- (Optional) Lock the aspect ratio to keep proportions.
- Click Save.
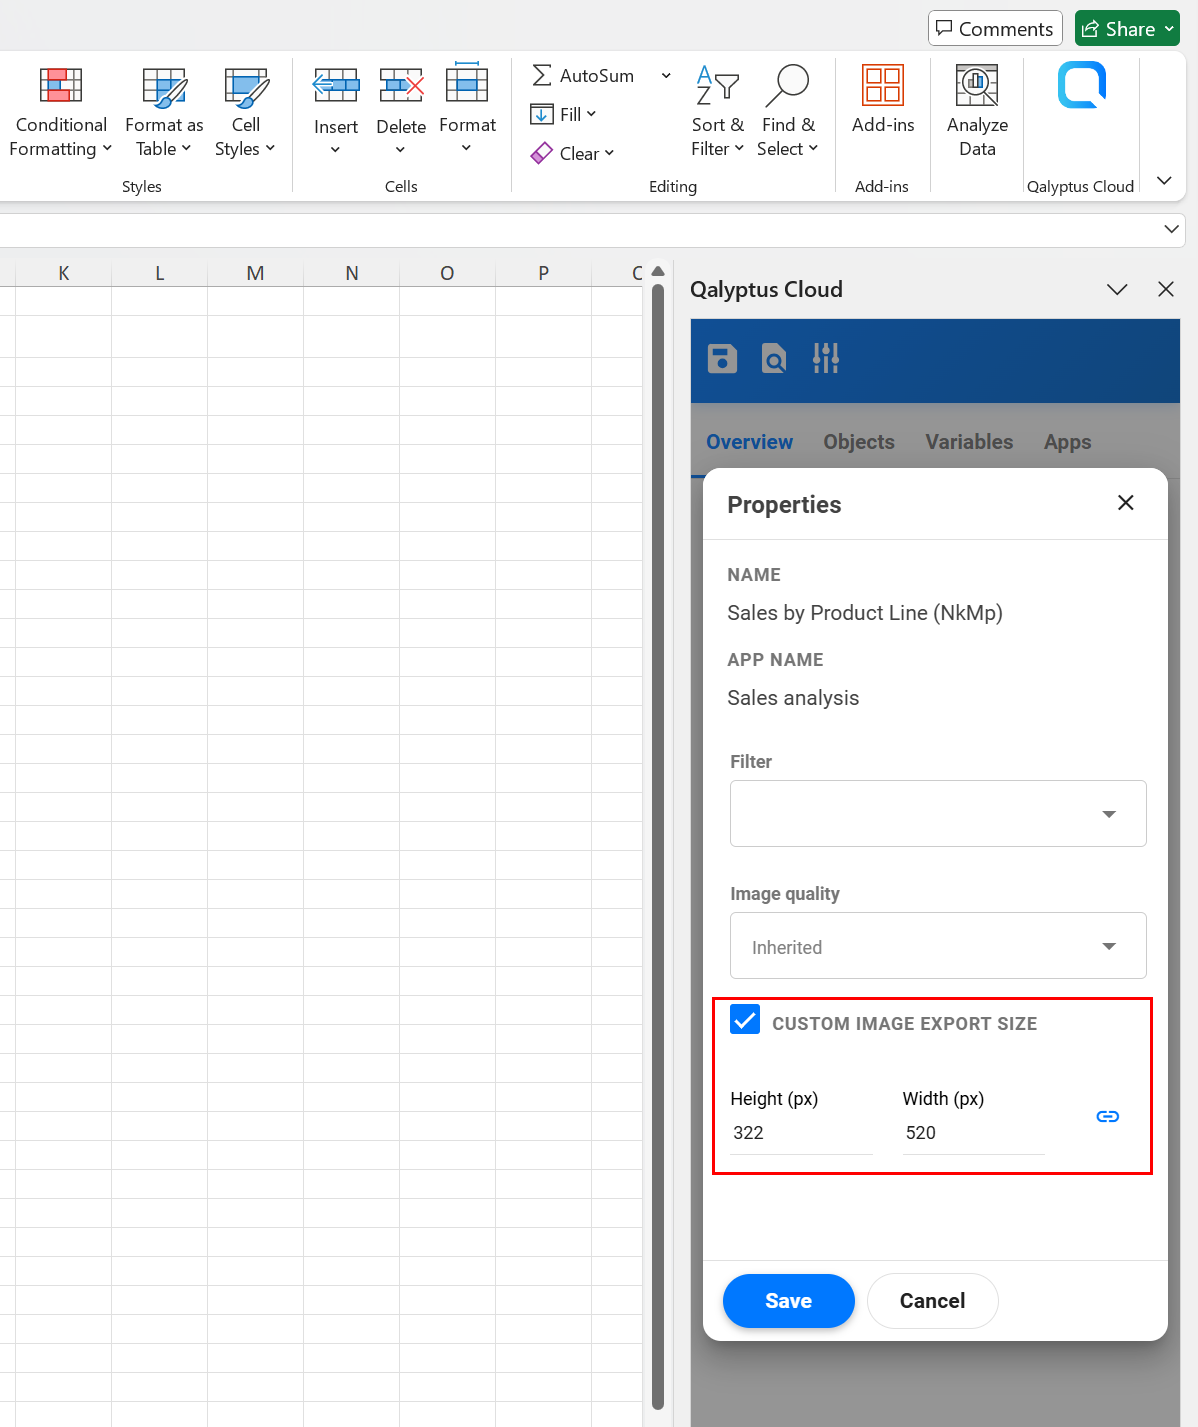
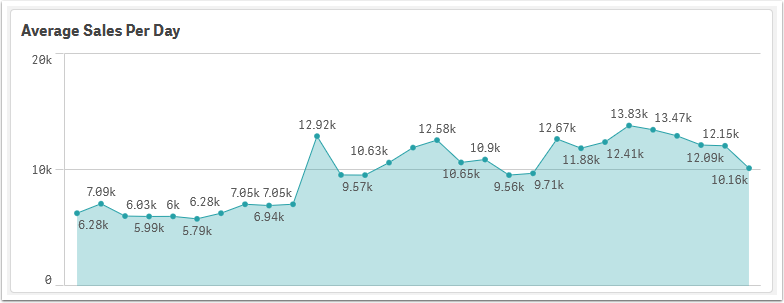
Chart with a small size (default export)
Same chart with a larger export size
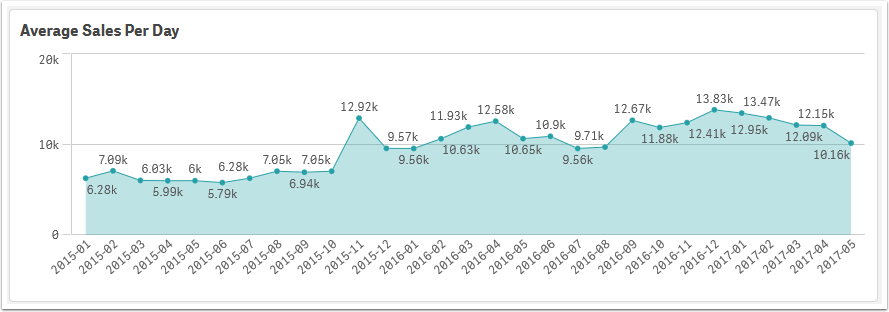
Use larger export sizes to capture more details in charts or prevent truncated data in tables.
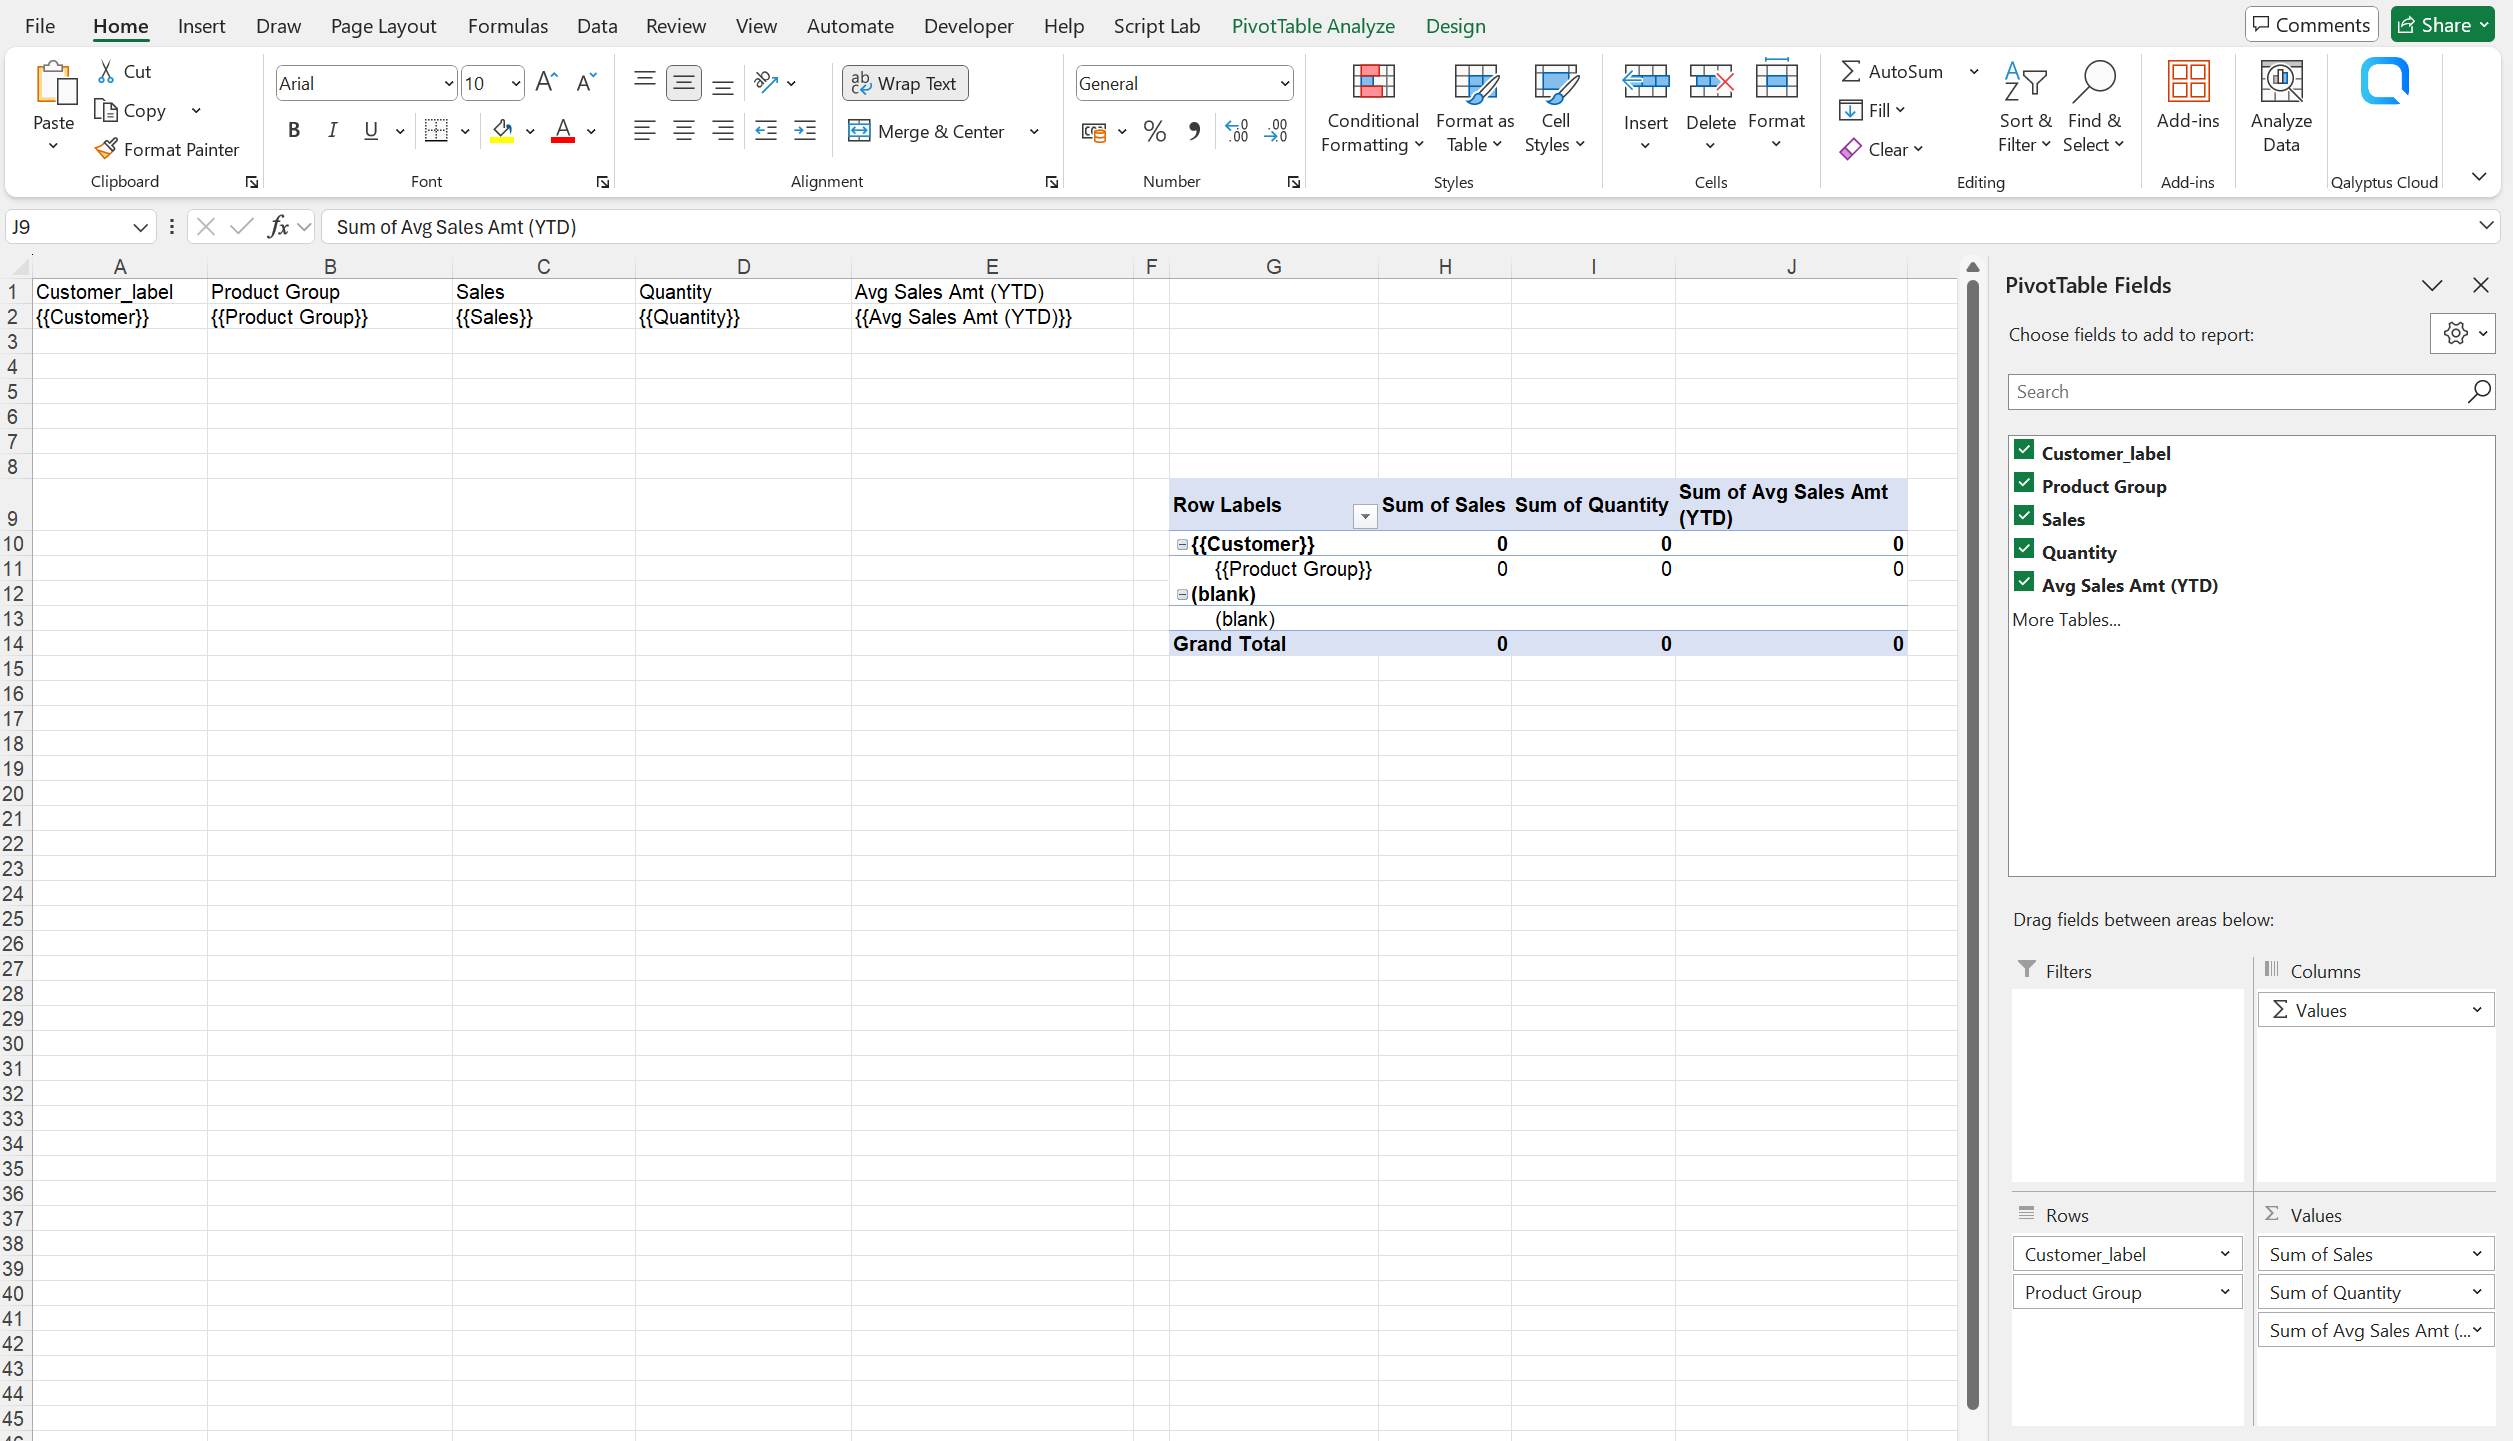
Create native Excel PivotTable
Qalyptus allows you to generate native Excel PivotTables using data from a Qlik Sense table (not from a PivotTable).
Steps:
-
Insert Qlik Sense table columns into your Excel template.
- Open the template.
- In the Overview tab, find the table object.
- Click the three dots button and select Insert columns.
- Do not insert the whole object tag.
-
Ensure headers do not contain Qalyptus tags.
- Remove the
{{and_label}}from the header. - Use plain headers (e.g.,
Salesinstead of{{Sales_label}}).
- Remove the
-
Add an empty row after the data source.
- Always include an empty row immediately after your data table when defining the PivotTable data source range.
- Required for PivotTable consistency.
-
Create the PivotTable in Excel.
- Select the data range (including the empty row).
- Go to
Insert→PivotTable. - Place the PivotTable on a new worksheet or in the same one.
-
Configure the PivotTable.
- Use Excel's PivotTable options to define your rows, columns, filters, and values as needed.
-
Preview the report to see the result.
You can hide the sheet containing the PivotTable's data source to keep reports clean.
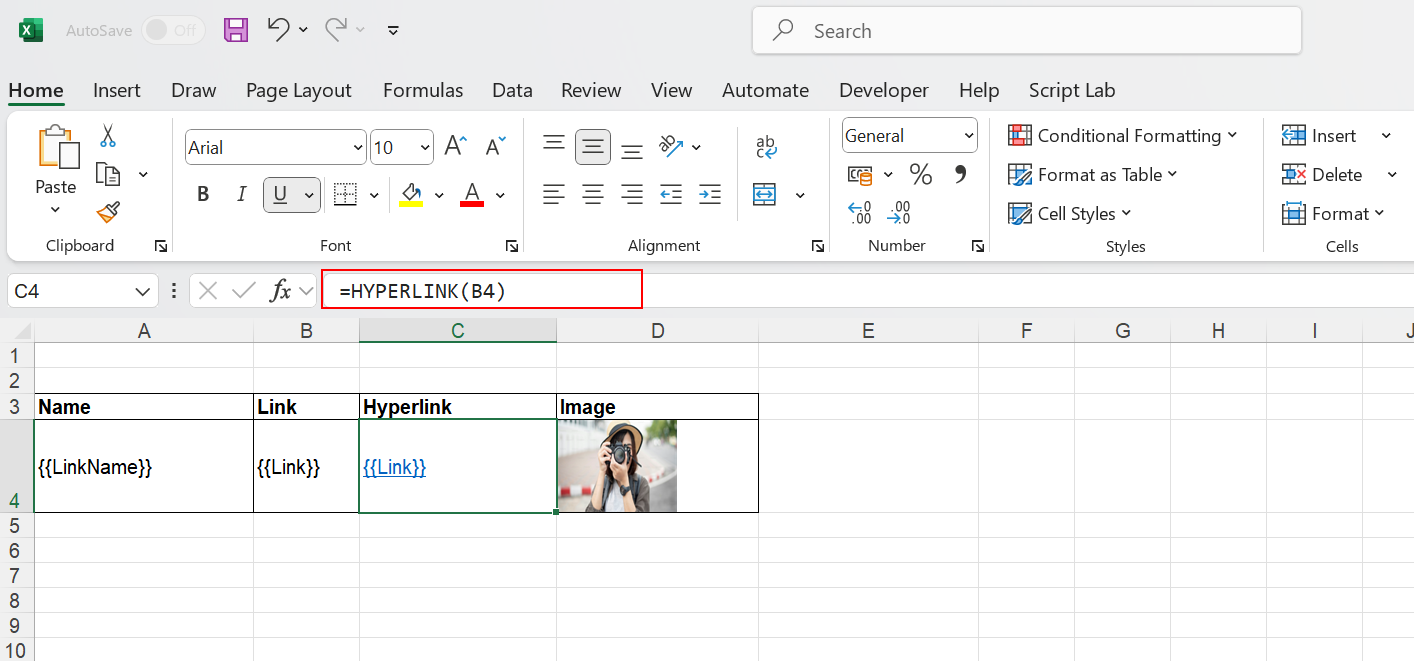
Export images and URLs in Excel reports
Qalyptus supports exporting URLs and images from Qlik Sense tables.
- URLs: Use the
HYPERLINK()formula to transform plain URLs into clickable links. - Images: Use the
IMAGE()formula to display images in cells.
The formula parameter must reference a cell that will contain the URL once the report is generated. You cannot use a Qalyptus column tag directly.
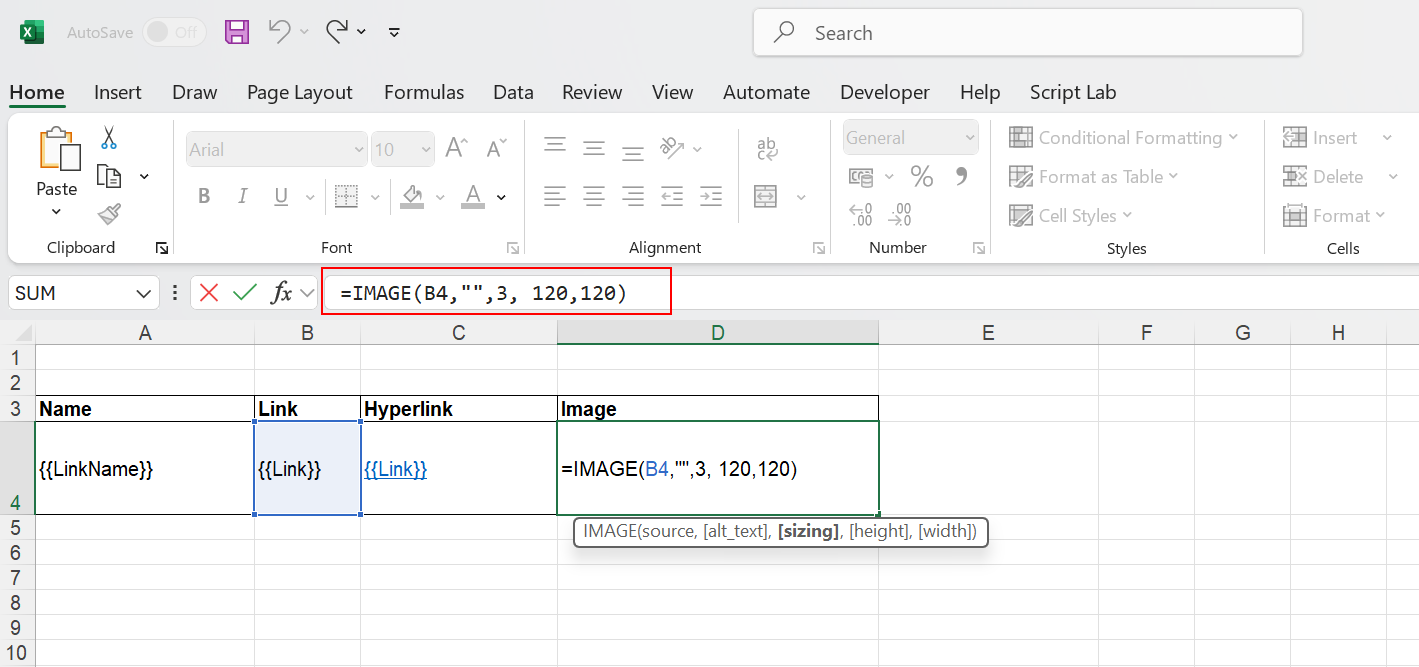
You can hide the column containing the raw URL or image source.
Use Excel formulas
Qalyptus supports Excel formulas for both columns and rows.
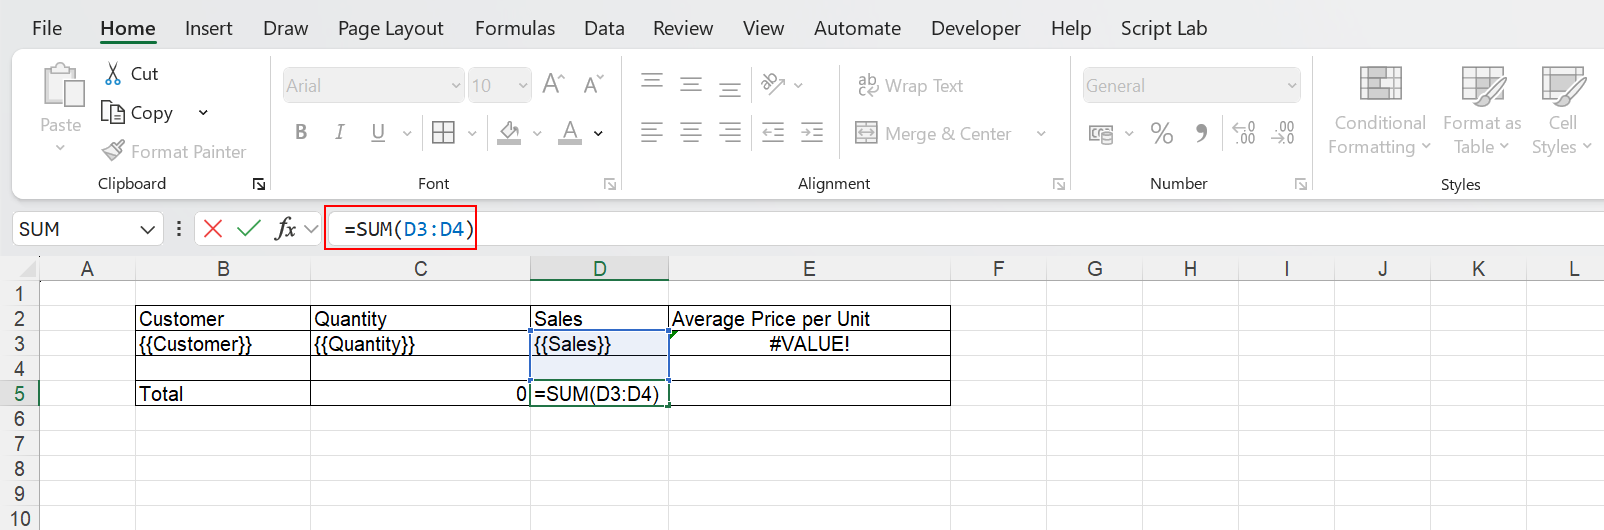
Formulas in columns
Use formulas for calculations on column data (e.g., totals).
Example: =SUM(A2:A10)
Formulas in rows
Use formulas for calculations across rows.
Example: =Sales/Quantity for Average Price per Unit.
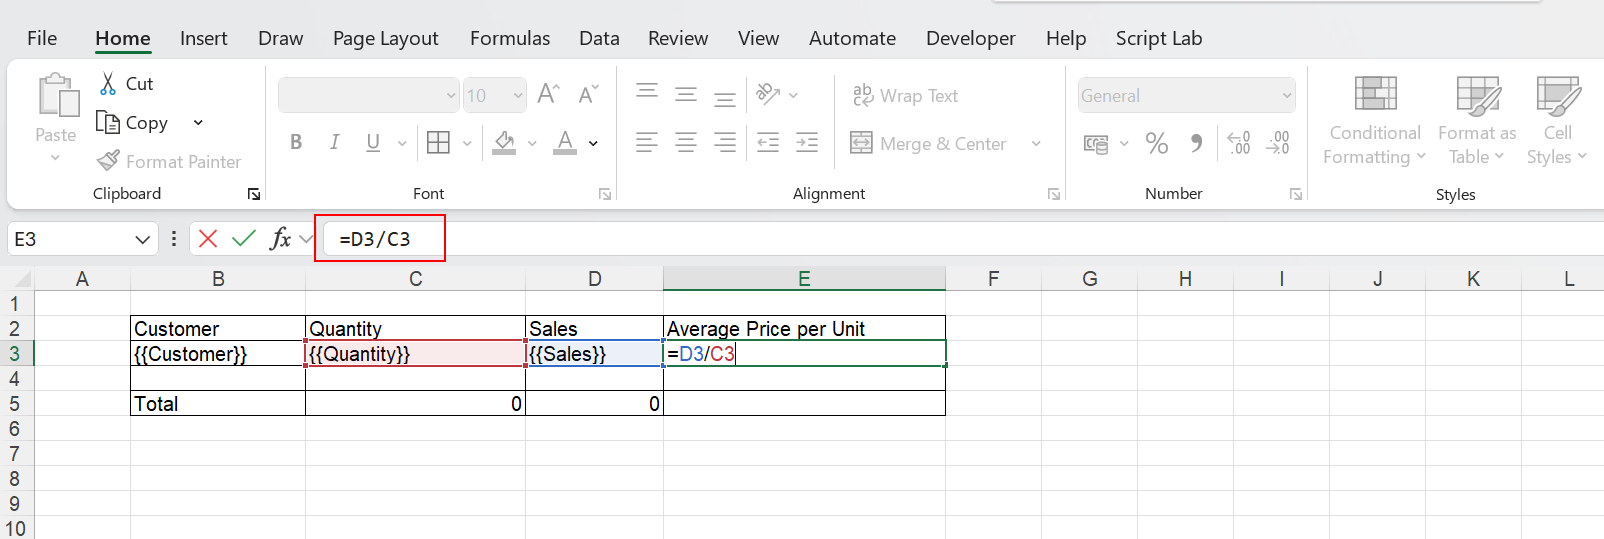
Row formulas must be placed in columns that are directly adjacent to table columns.