Powerpoint Templates
Overview
In this section, we will create a PowerPoint template using Qlik Sense objects.
To create a PowerPoint template, go to the Templates tab and click Create button. Your screen will look something like this:
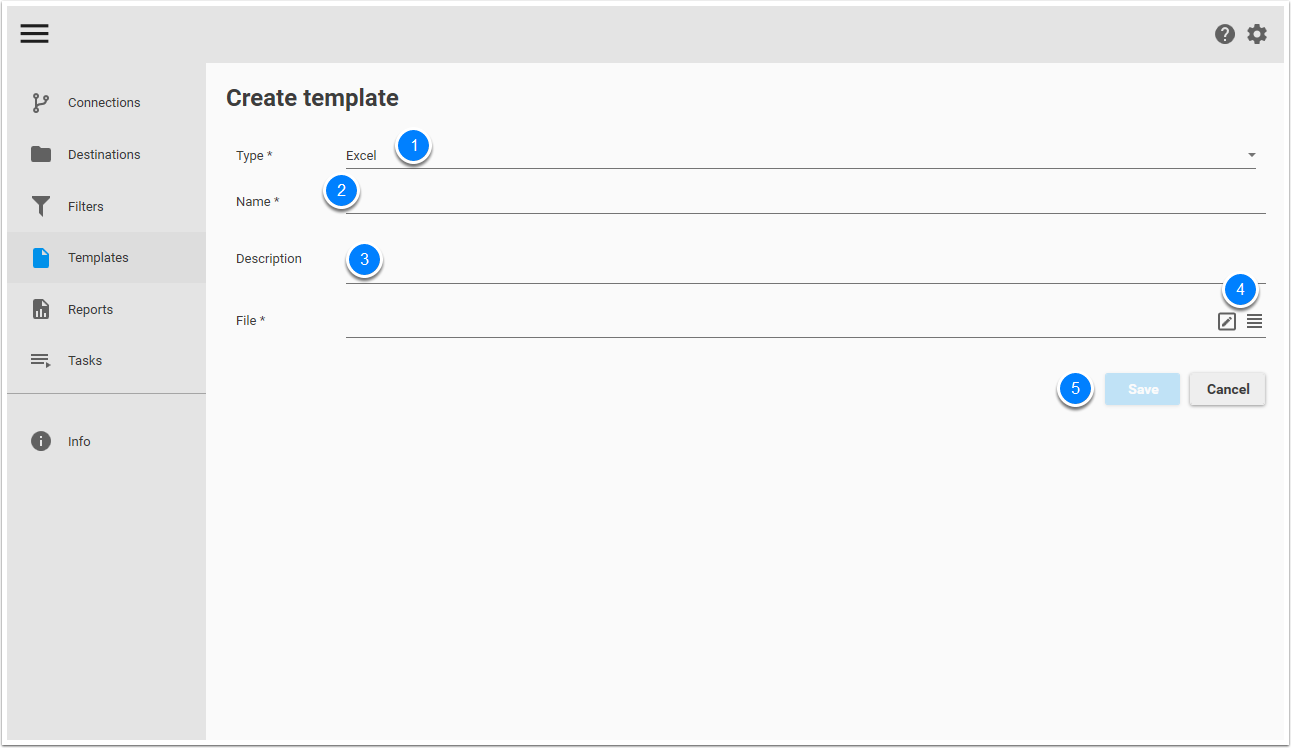
- In the Type drop-down menu, select PowerPoint.
- Give a name to your template. Example:_ Performance PowerPoint_ template.
- It is recommended to add a description.
- You have two options to create a new template. You can click
to create a new PowerPoint file or click
to create your template from an existing PowerPoint file.
- Save your work.
Click to create a new PowerPoint file. Your screen will look something like this:
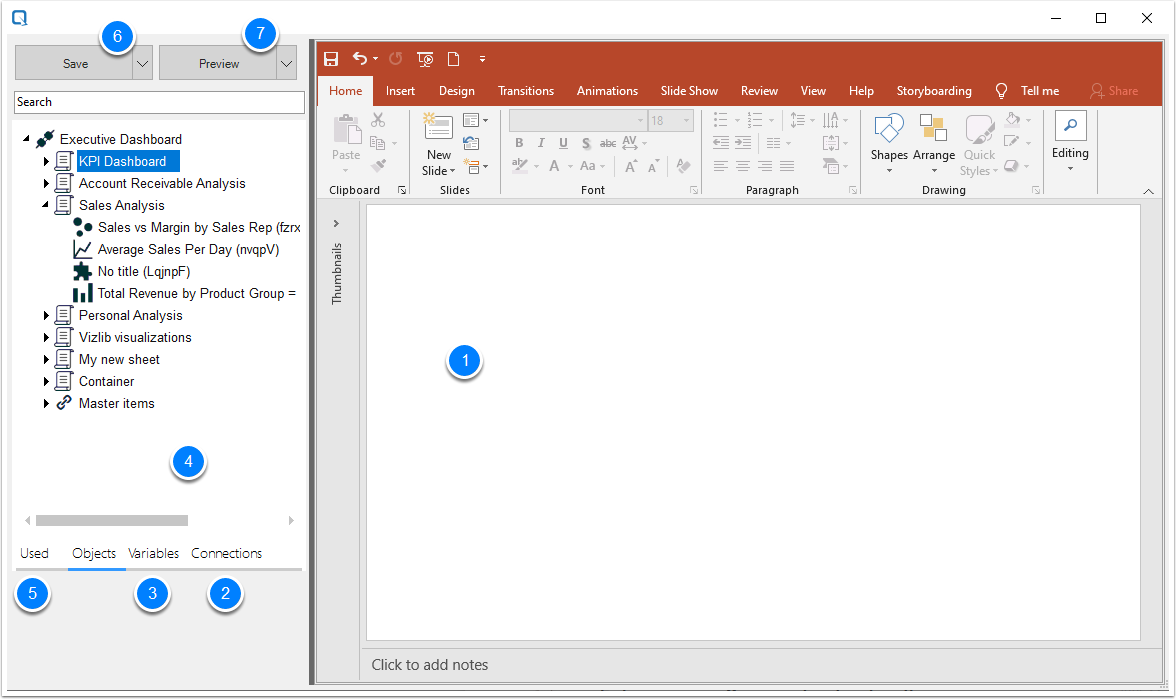
- A PowerPoint file is open in the Qalyptus.
- Connections: list of the Qlik Sense and QlikView connections created in the Connections page.
- Variables: list of the Qlik variables of the selected connections. Select the ones you want to use.
- Objects: list of the Tables, Charts, and Master Items of the selected connections. Select the ones you want to use.
- Used: here, you will find the objects and variables you want to use in your template.
- Save button allows you to save the template.
- The preview button allows you to have a preview of the report.
Add objects to create the template
After opening the Template Editor, you can begin designing your report.
Step 1: Select Connections
In the Connections tab, select one or multiple connections to use for the report. A connection represents a Qlik Sense application.
Step 2: Select Variables and Objects
To add variables and objects (charts and tables) to the template file, follow these steps:
Navigate to the Objects and Variables tabs to view all available items from the selected connections. The Used tab will display the items you’ve selected to include in the template.
Adding a Variable
- Go to the Variables tab.
- Right-click on the desired variable.
- Click Use the variable.
- Go to the Used tab.
- Drag and drop the variable into the template file.
- Format the variable and adjust its position as needed.
Adding an Object (Chart or Table)
- Go to the Objects tab.
- Expand the sheet containing the object.
- Right-click on the object.
- Choose one of the following options: Use as a table or Use as an image
- Go to the Used tab to locate the added object.
- Adding Objects as Images
- Drag and drop the object into the template file.
- Move and resize the image as needed.
- Adding Objects as Tables
- Drag and drop the entire object or expand it and drag individual columns to the template file.
- Option 1: Export the entire object as it appears in Qlik Sense.
- Option 2 (Recommended): Export individual columns for more granular formatting.
- Formatting Tables. Use formatting options to customize your tables and pivot tables. For example: Change font style and size, adjust cell colors, add conditional formatting.
An object can simultaneously be used both as a table and as an image. Additionally, you can select the same object multiple times as an image or table to apply different configurations.
For example, you can use a pie chart twice as an image: the first instance without any filter, and the second instance with a filter applied to display data from the previous year.
Qlik Sense tables and pivot tables are exported without their original formatting. Qalyptus uses the Qlik Sense API, which does not support exporting tables with formatting.
Previewing the Report
Preview your report to see how it looks after adding Qlik Sense objects to the template.
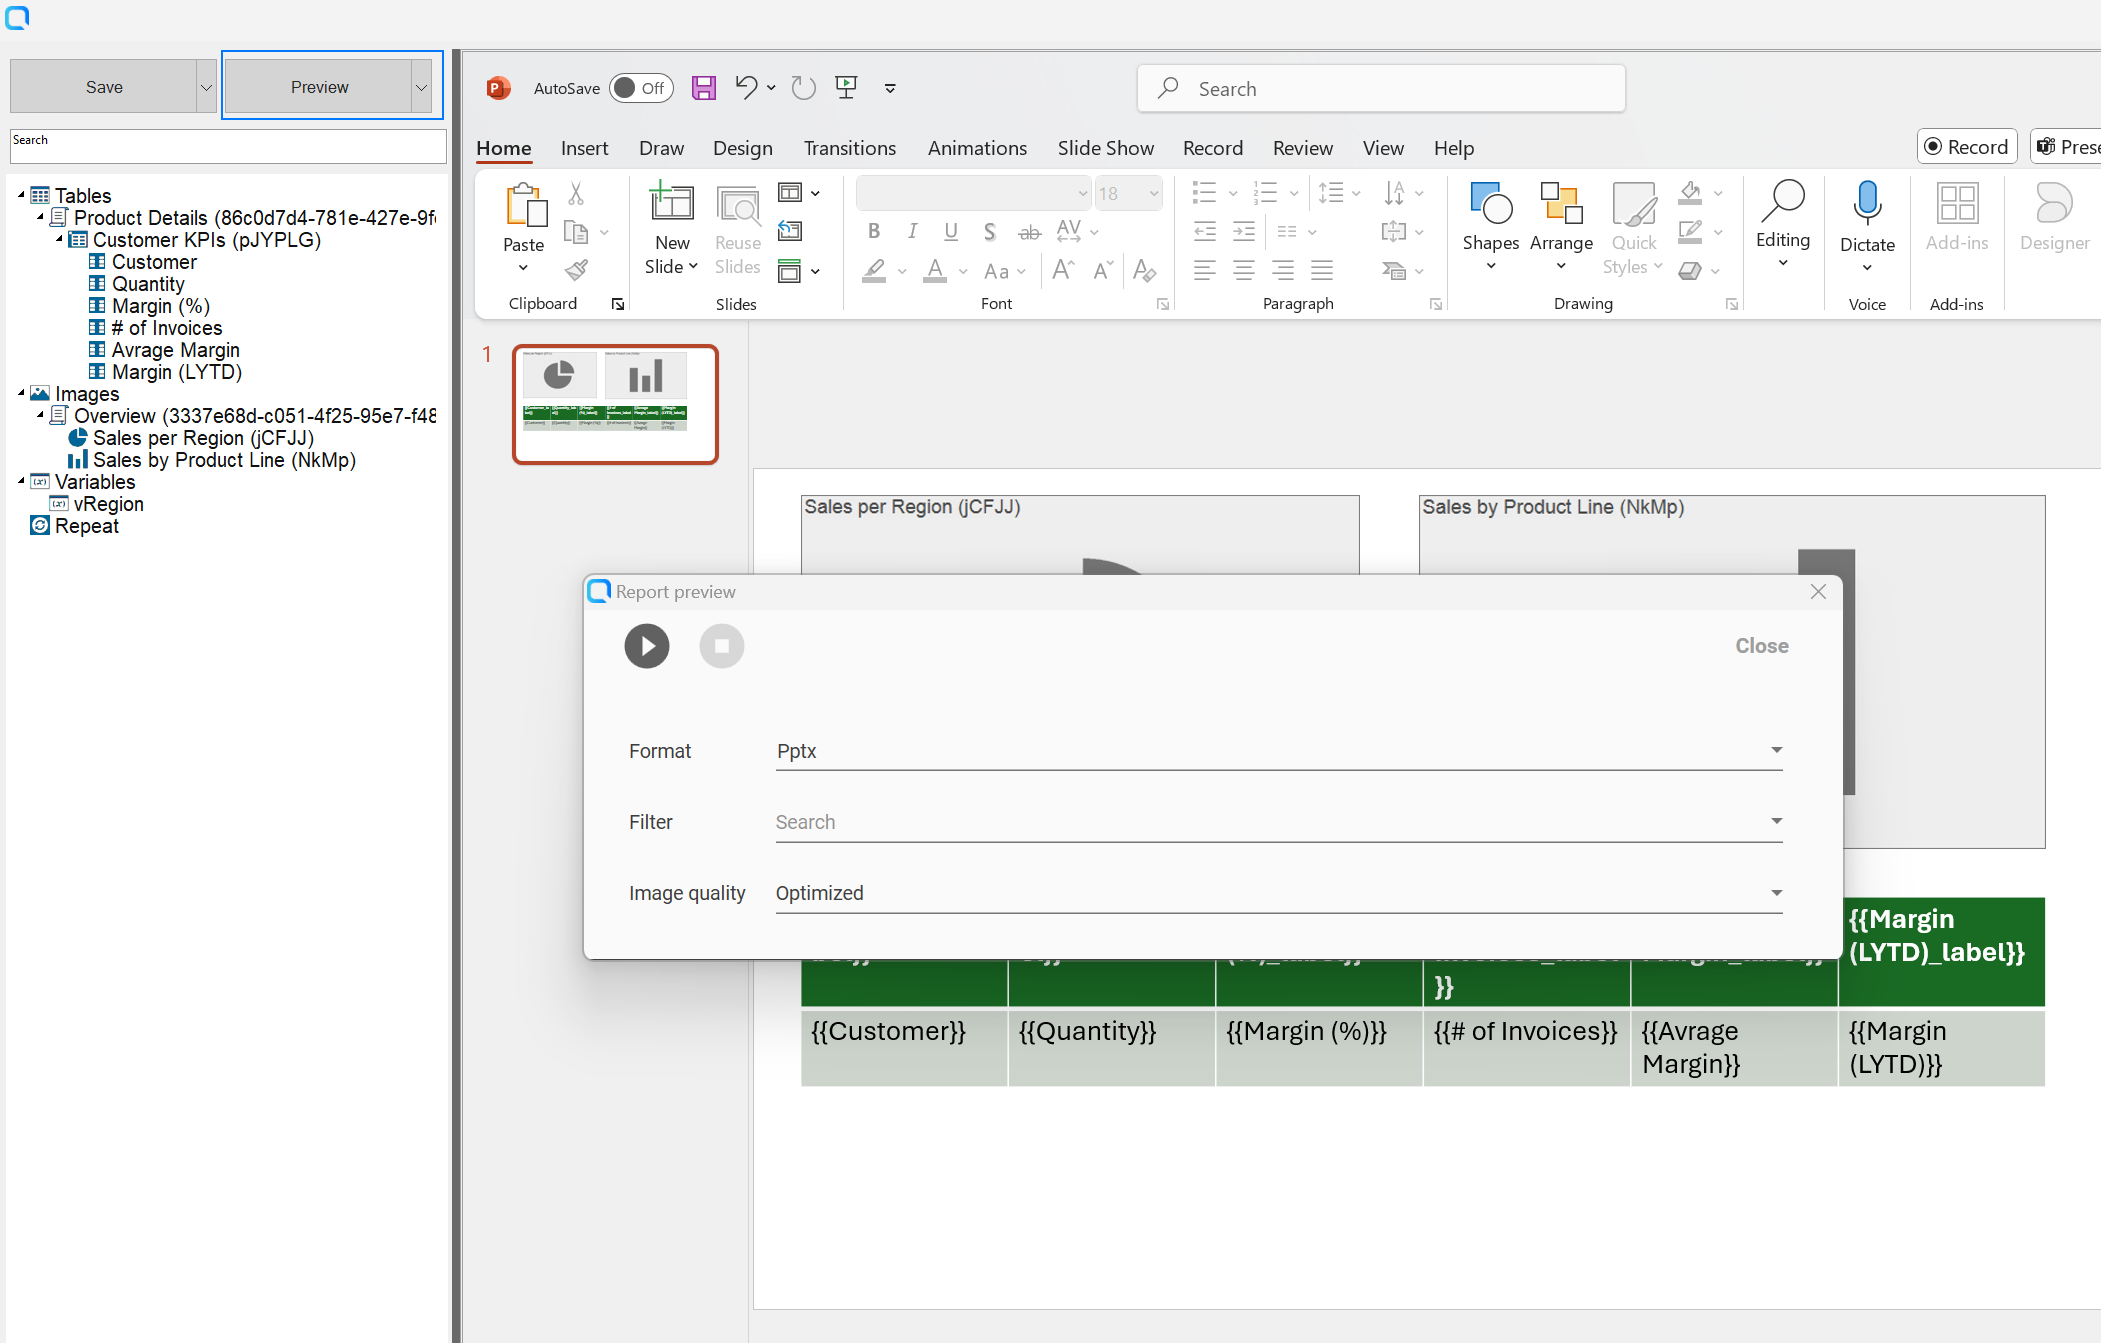
1- Default preview
Click the Preview button to generate the report with default settings:
- Output format: .xlsx
- No filters applied.
- Image quality: Optimized.
- You can stop and restart the generation process at any time.
- Advanced Preview
Click the dropdown menu on the Preview button and select Advanced Preview to customize the report generation:
- Choose the output format.
- Apply a filter at the report level. Filters at the object level will still apply after the report-level filter.
- Set the image quality for all report objects.
- Stop and restart the generation process as needed.
The quality setting in Preview applies only to objects with their image quality property set to Inherited. If an object has a specific image quality setting, that will take precedence.
Third-party objects (extensions) and sheets exported as images will always use Standard image quality. It is not possible to select another option for these items.
Video Tutorial
This short video demonstrates how to use Qlik Sense objects to create a simple PowerPoint template.
Add a filter to an object
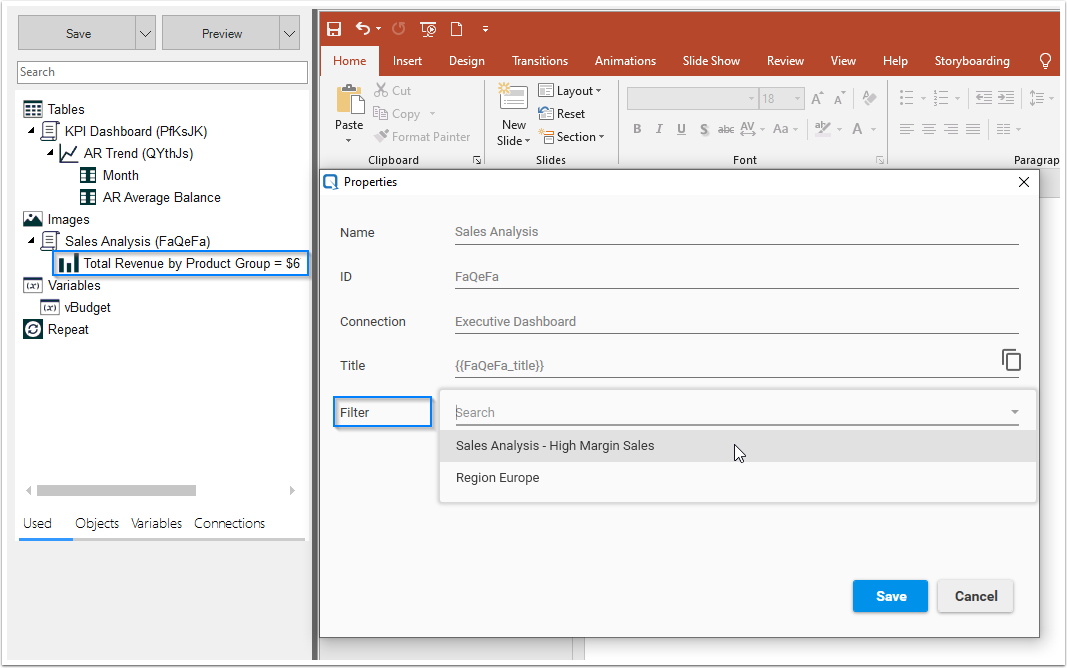
In addition to applying filters at the report and task levels, you can apply a filter for each Qlik object you use in your template.
Right-click on the object you want to add a filter, then select Properties. In the Properties screen, select the filter to apply from the available filters. Note that only one filter can be applied to an object.
Choose image quality
You can customize the image quality for each object exported as an image.
By default, when an object is selected as an image, its quality is set to Inherited, meaning it will follow the quality settings defined at the report level. If an object's image quality is set to a specific value other than Inherited, that value will take precedence during report generation.
Image Quality Options:
- Standard: 144 DPI. A universal setting compatible with all object types.
- Optimized: 92 DPI. Designed for reduced file size while maintaining clarity.
- Medium: 150 DPI. Provides a balanced resolution for most use cases.
- High: 300 DPI. Offers the best quality, ideal for print-ready documents.
To change the image quality of an object, follow these steps:
- Go to the Used tab.
- Right-click on the object you want to modify.
- Select Properties from the context menu.
- In the Properties window, choose the desired Image Quality option.
- Click Save to apply the changes.
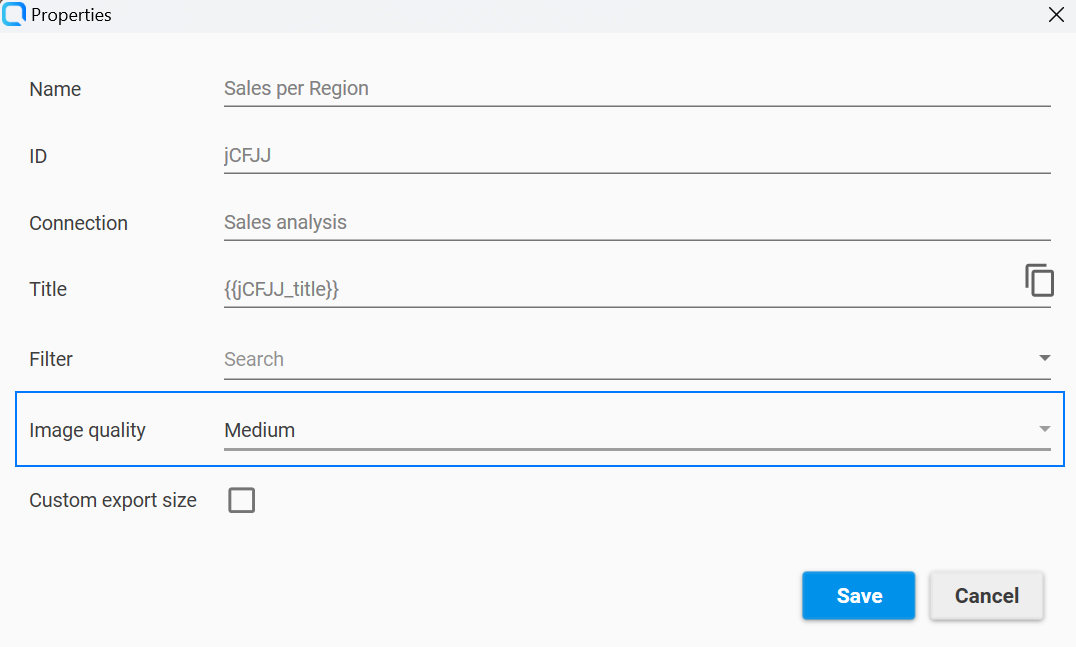
If the export fails at Optimized, Medium or High quality, Qalyptus will automatically attempt to export the object using Standard quality.
Third-party objects (extensions) and sheets exported as images will always use Standard image quality. It is not possible to select another option for these items.
Export an object with a different size
This feature allows you to export a Qlik Sense object as an image with a size different from how it is used in the template file.
When you add a Qlik Sense object (chart or table) as an image in your report template, simply drag and drop the object into the template. Qalyptus creates a placeholder image that you can resize within the template. During report generation, Qalyptus exports the Qlik Sense object at the size of the placeholder image and places it accordingly in the report.
You can choose to export the image at a larger or smaller size than its usage in the template. For instance, you can export an image at 1200 x 800 px and use it in the template at 1000 x 600 px. This flexibility allows you to adjust the appearance of images in your report while maintaining high-quality exports.
To choose a custom export size, do the following:
- Go to the Used tab.
- Right-click on the object you want to modify.
- Select Properties from the context menu.
- In the Properties window, select the option Custom export size, then enter the Height and Width value. The default values represent the estimated size of the object as it appears in the Qlik Sense app.
- Use the Maintain Proportions option to ensure the image retains its original aspect ratio when you adjust either the width or height.
- Click Save to apply the changes.
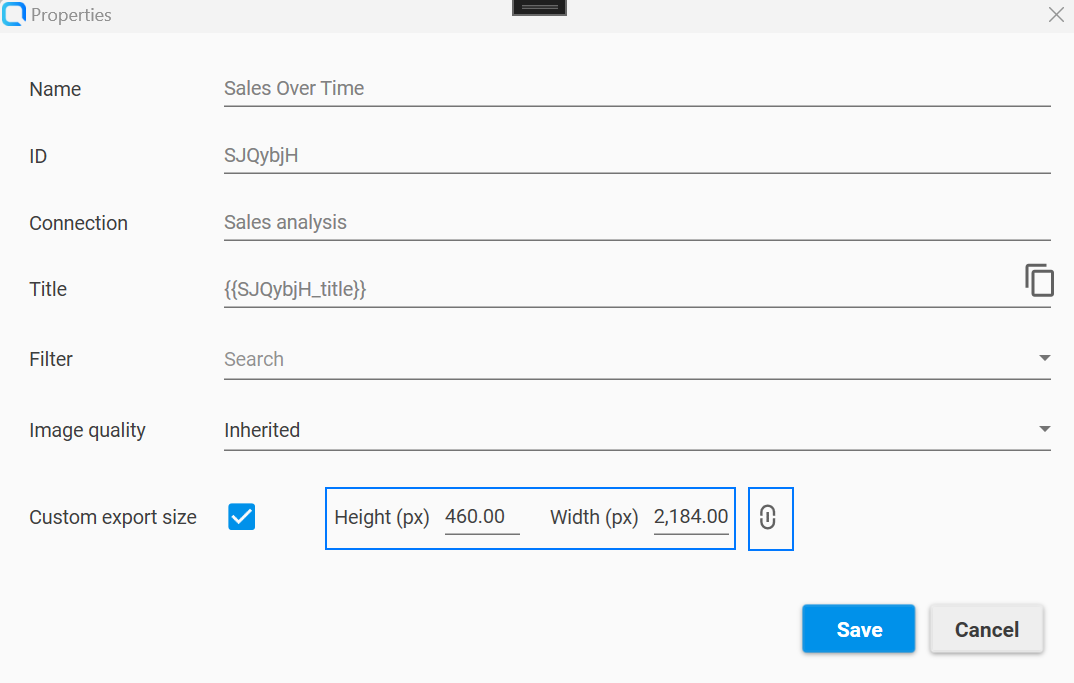
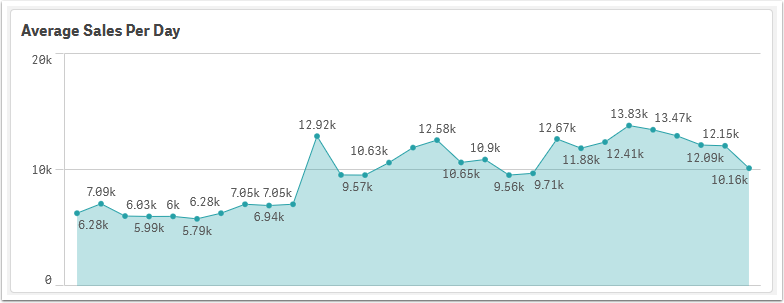
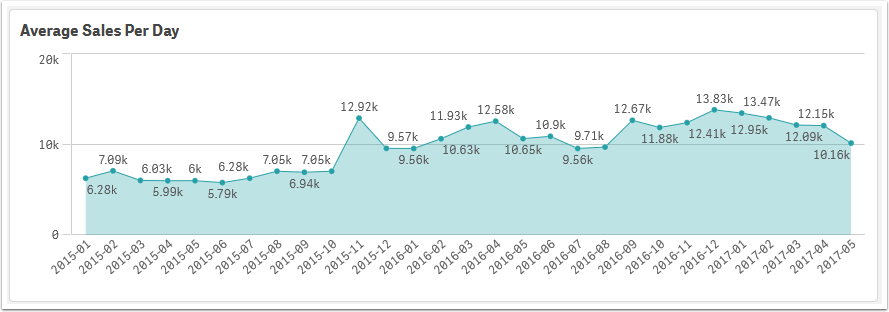
Exporting an object at a larger size ensures that you capture more details. This is particularly useful because Qlik Sense may hide certain information when the object's size is reduced.
Chart with a small size (export size = size of use )
The same chart with a large export size (export size > size of use )
Repeating objects across multiple slides
You can repeat the contents of a PowerPoint slide for each value in a dimension field.
Create a PowerPoint native chart
You can create a PowerPoint chart with data from a Qlik Sense object (chart or table).
Template status
A template can have three different status:
- Valid template
- File not found
- No objects or variables used