Create reports
Qalyptus allows you to create QlikView and Qlik Sense reports based on custom templates.
Create a simple report
To create a report, go to the Reports tab and click Create button. Your screen will look something like this:
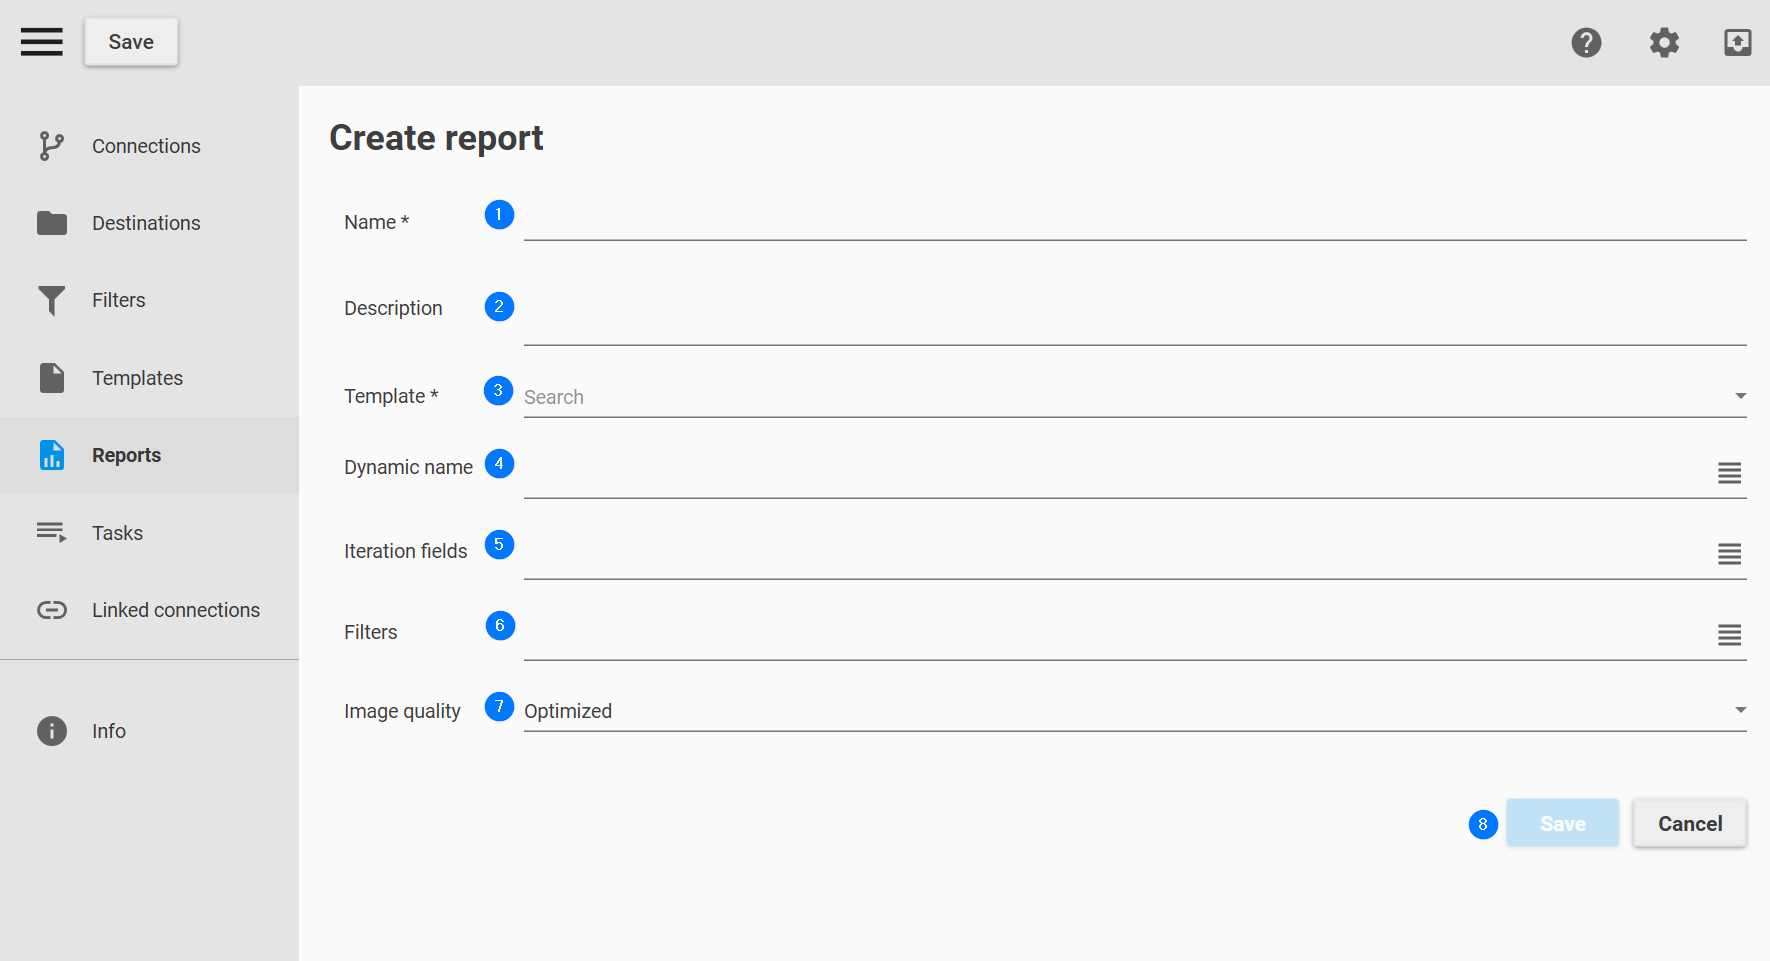
- Provide a name for your report. For example: Performance PowerPoint Report.
- Adding a description is recommended for better clarity and organization.
- From the Template drop-down menu, select the Performance PowerPoint Template.
- Optionally, assign a dynamic name to your report by clicking the Dynamic Name button. For more information, refer to the Create an Iteration Report section.
- Apply one or more filters to refine your data before generating the report. Learn more about filters.
- Set the image quality for objects exported as images. The selected quality will apply exclusively to objects whose image quality property is configured as Inherited.
- Finally, click Save to save the report.
Your report is created and can be used in Tasks.
Third-party objects (extensions) and sheets exported as images will always use Standard image quality regardless of the image quality chosen.
Create an Iteration report
With Qalyptus, you can also create your report by dimension. For example, Year, Region, or Seller. You can use one dimension or combine several dimensions such as Year->Seller.
To create an Iteration report, do the following:
- Follow the same steps to create a simple report
- Click the Iteration fields button. A new window will open
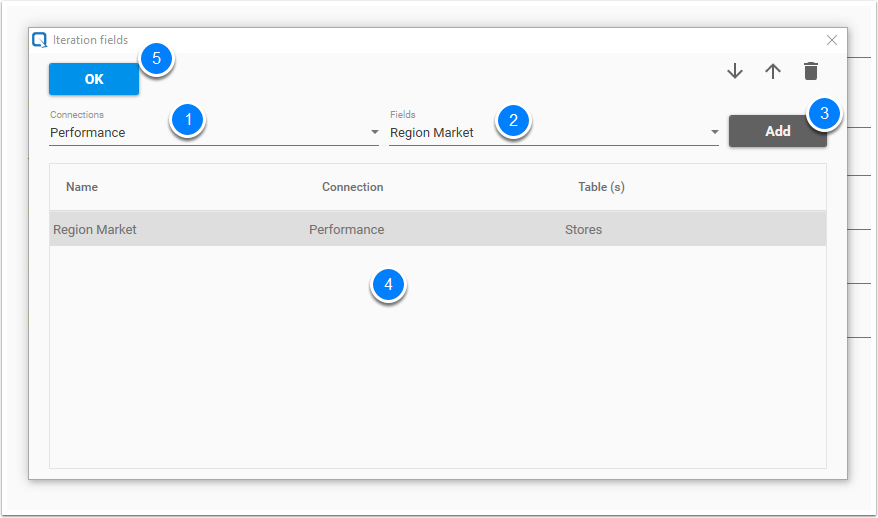
- Select the Performance connection in the connections list
- Choose Region Market field in the Fields list
- Click Add button
- Your filter is added
- Click the OK button to validate your work
You will have six different files when you generate the report because there are six values in the Region Market field.
To be sure that each file name will be unique, you need to give a dynamic name to your report. For the name to be unique, it should contain either the values of the iteration field or a variable with a unique value for each value of the iteration field.
In our case, we will create a dynamic name composed of the name of the report and the value of the field of view: Performance PowerPoint report_Region Market.
To create a dynamic name, click the Dynamic name button. A new window will open.
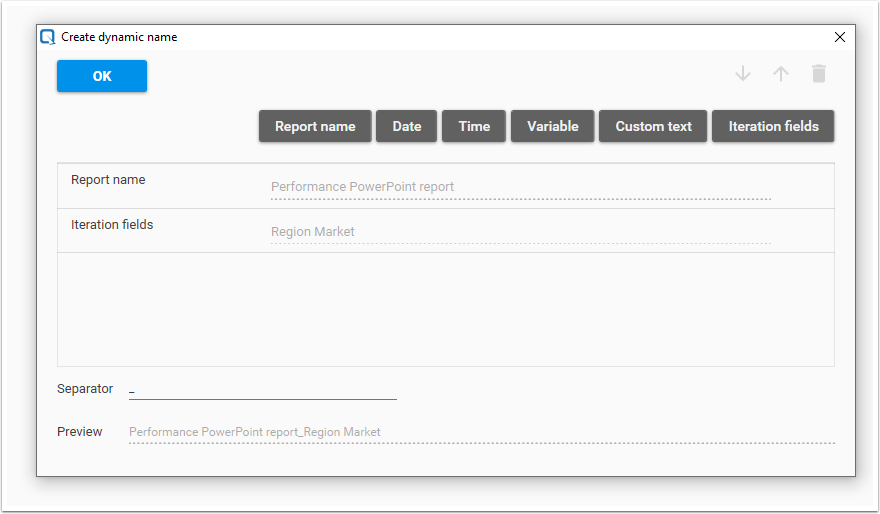
- Click Report name
- Click Iteration fields
- The Report name and Iteration fields are added to the dynamic name
- By default, the separator is “_”. You can change it
- Click the OK button to validate your work
Your screen will look something like this:
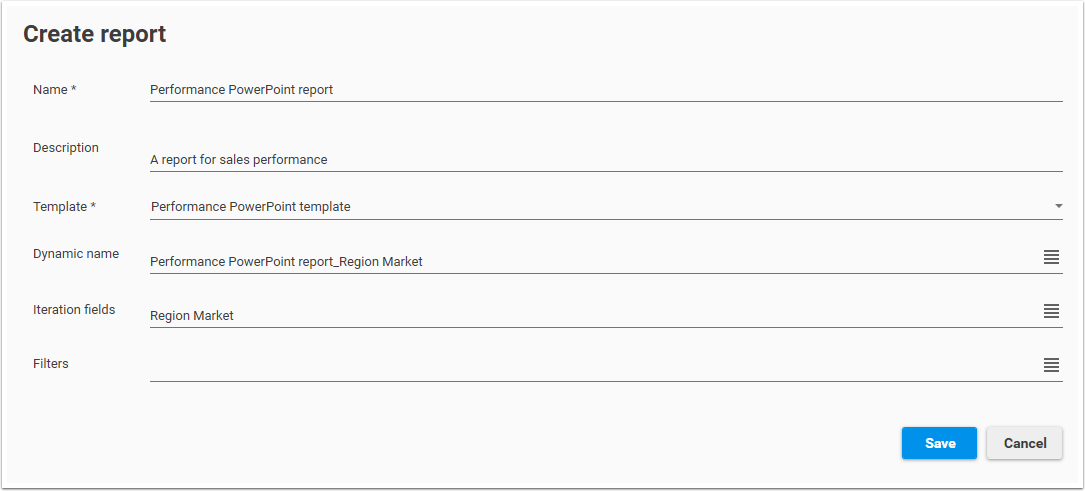
Finally, click Save to create and save the report.
Your report is created and can be used in Tasks.
Create an Iteration report with a linked field between multiple Qlik Sense applications
You can create an Iteration report using the same dimension field in multiple Qlik Sense applications. For example, create a report for the salespersons using two Qlik Sense apps that contain the field Salesperson. Qalyptus will loop throw the values of the two fields simultaneously and generate the files.
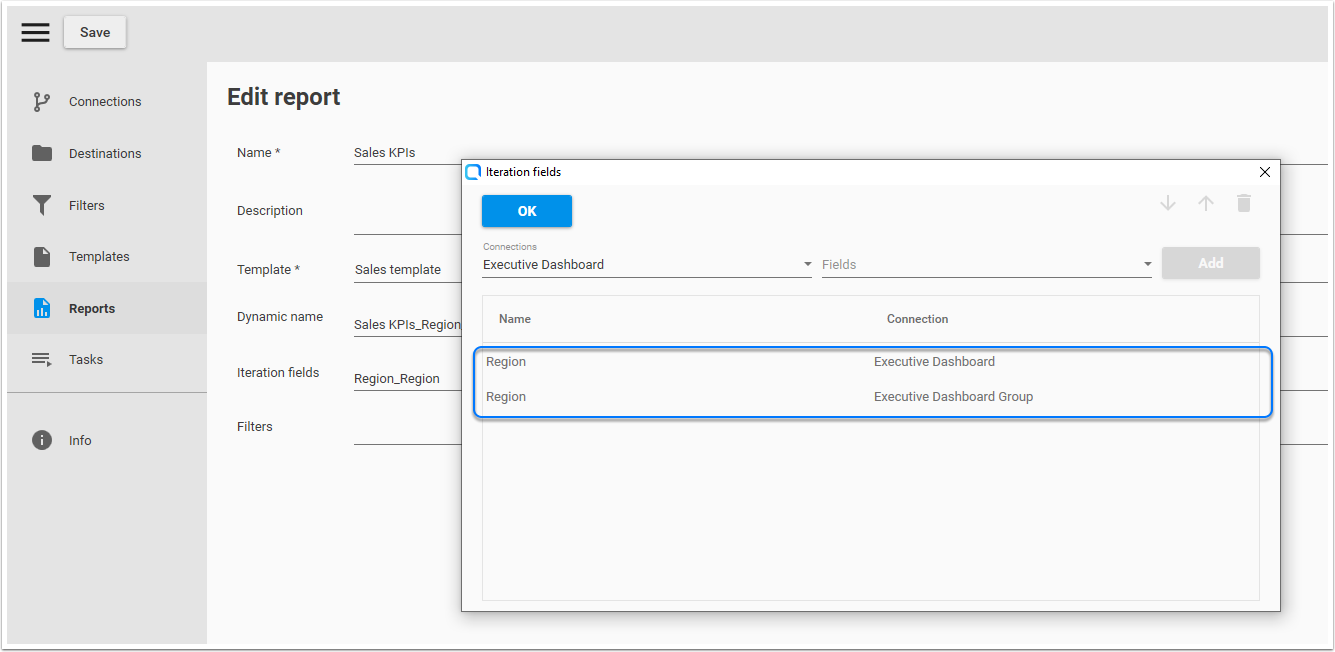
There are limits to this feature.
- The Iteration field must have the same name in all the applications to be linked.
- Qalyptus will take the first field in order as a reference field, it will iterate over the values of this - field. If in the other applications the value exists but is not available (in gray color), it will still be selected in these applications. If the reference field does not contain an X value and this value exists in other applications, the value will not be selected and no report will be generated for that value.
- The functionality does not work as expected when using multiple nested fields.
Status
A report can have four different statuses:
- Valid report
- No template assigned to this report
- The template of this report is not valid
- One or more filters of this report are not valid